Today on Morning Joe, Rattner charts the economic and political indicators that look as bad for Trump as they did for Bush in 2006 — or worse.
With less than a month remaining before the midterm Election Day, pundits are trying hard to read the tea leaves in an era when political polls have increasingly proved inaccurate. In that context, attention has turned to another election with some striking similarities to this year’s: the 2006 midterms in which George W. Bush’s Republicans were shellacked, losing control of both the House and the Senate. As with this year, in 2006, voters were faced with a war, rising costs and consequently, a deeply unpopular president.
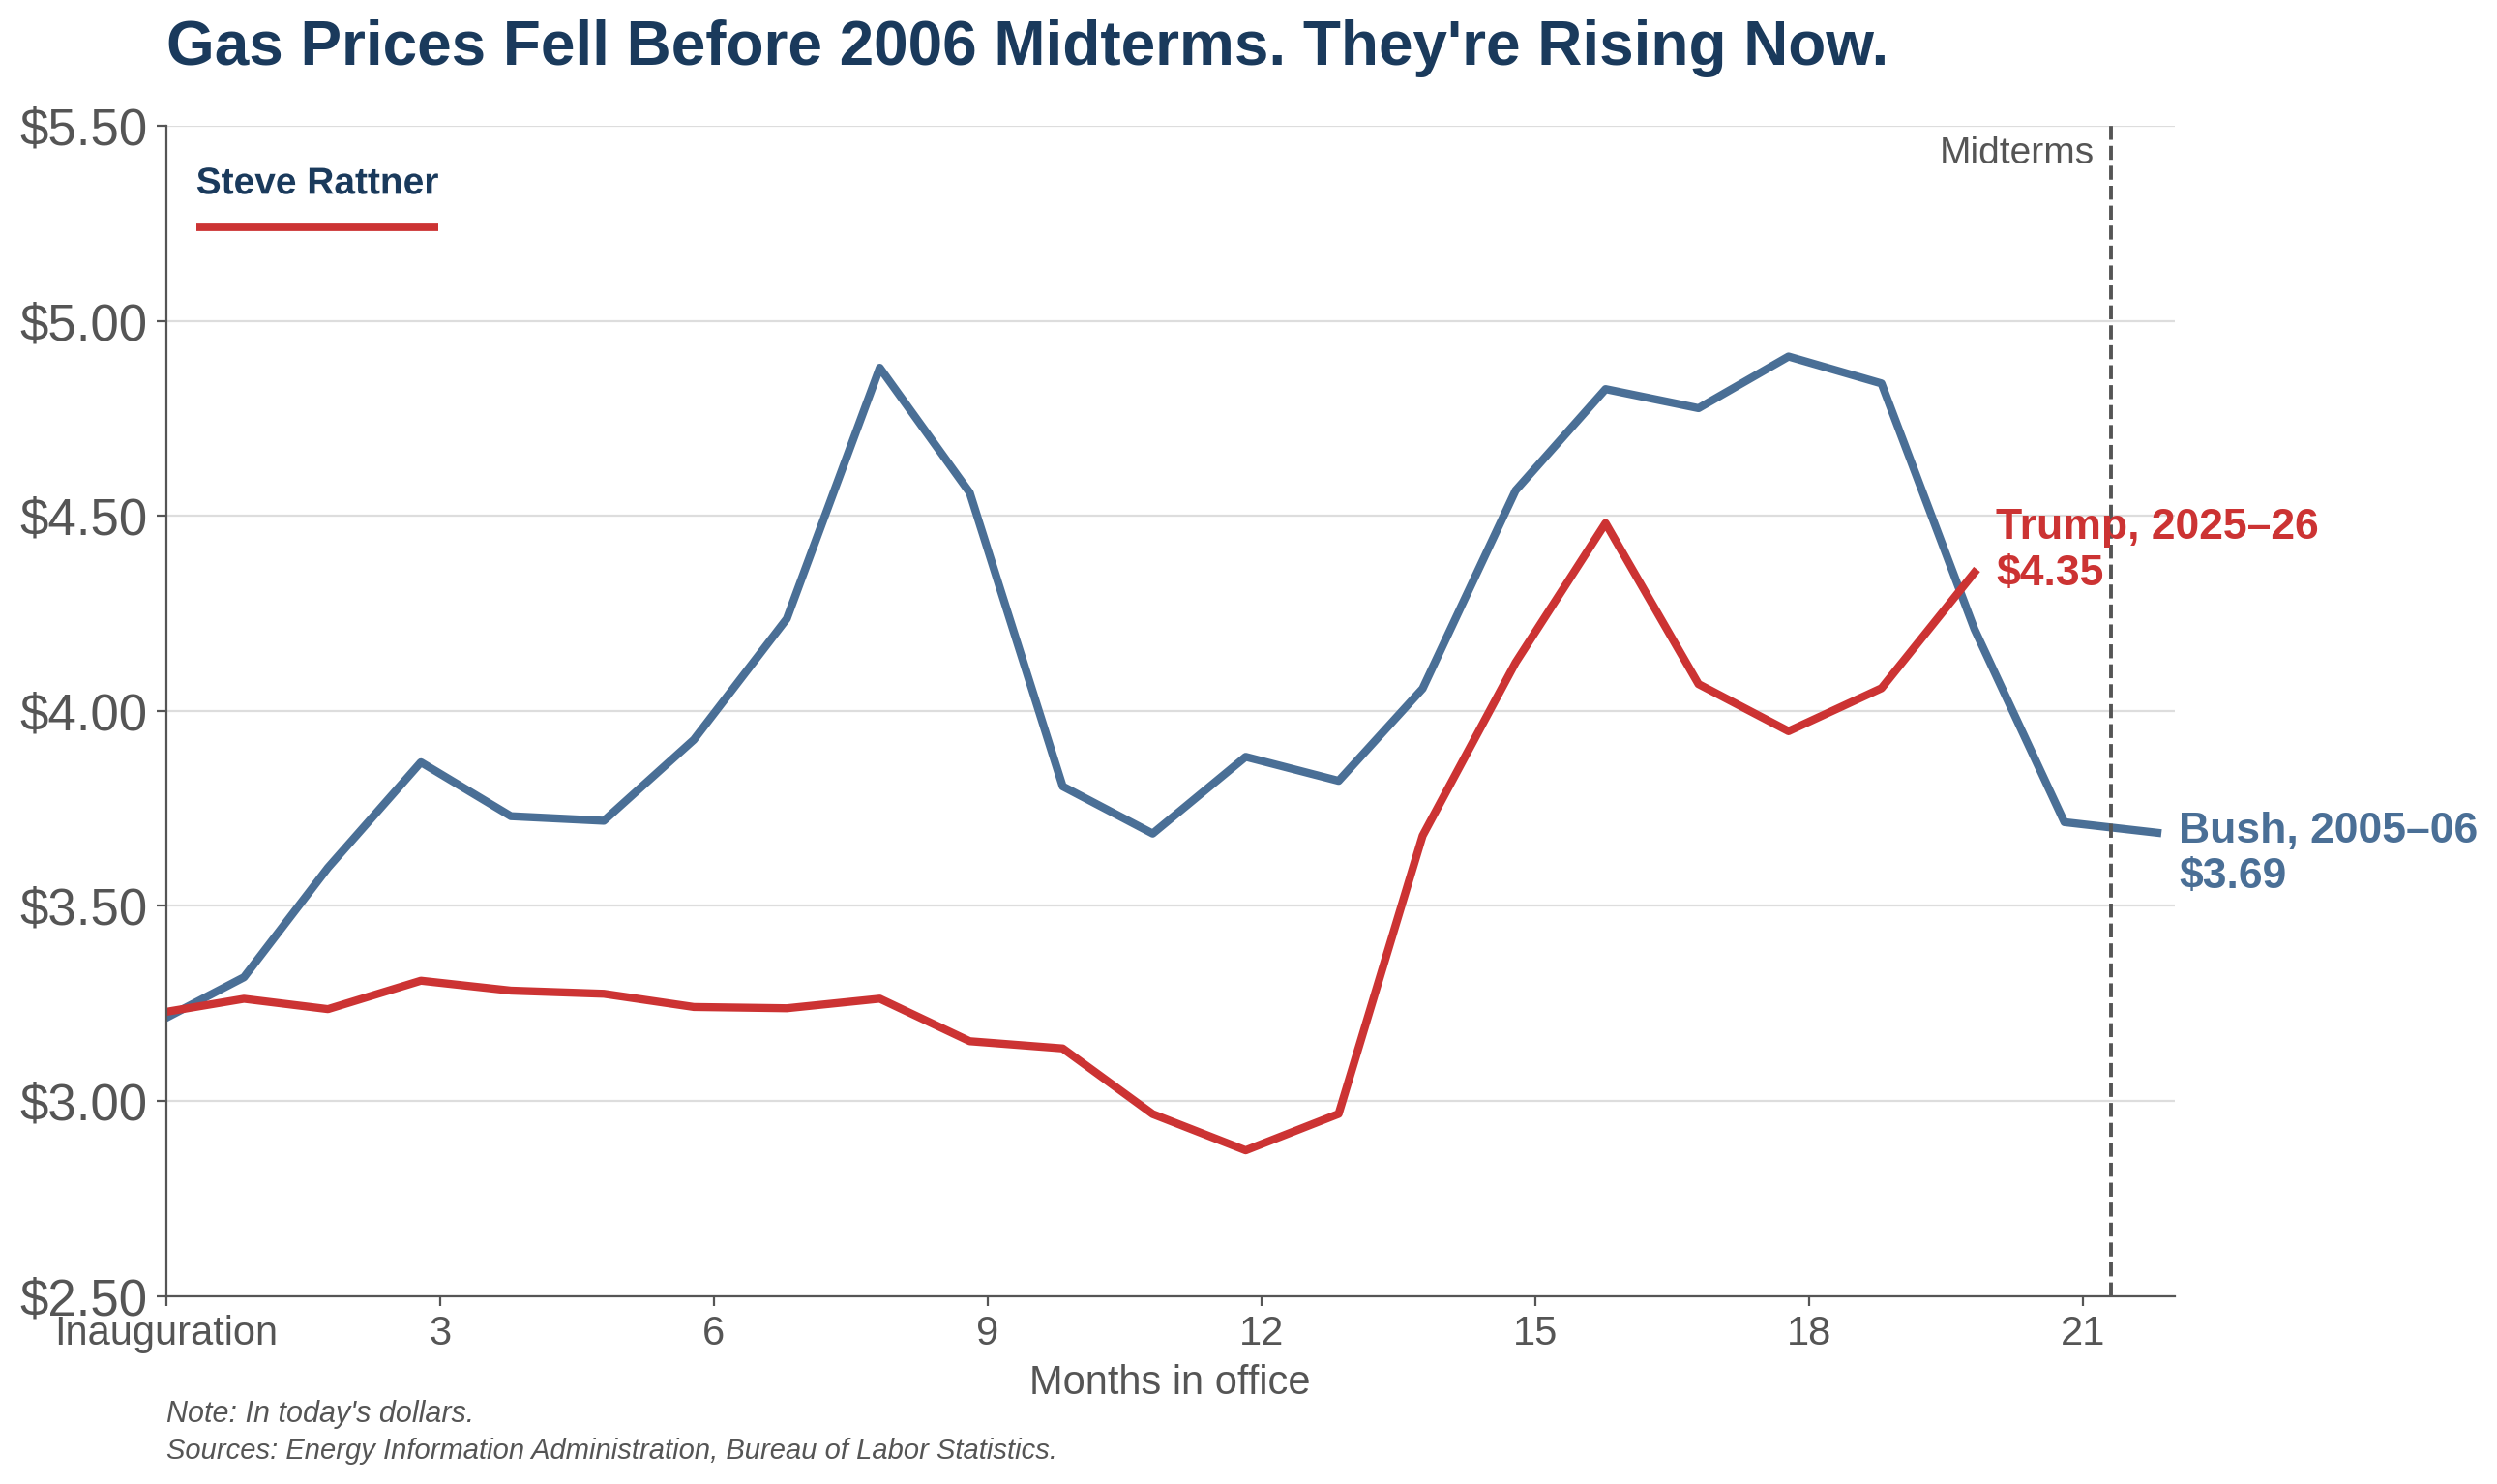
In some respects, Donald Trump is facing a more difficult situation than Bush confronted. In 2006, gasoline prices were an issue, as they had shot up by more than 50% in the first 18 months following Bush’s second inauguration. But in the middle of 2006, they began to decline and by Election Day, they were only slightly higher than they had been when he entered office. Under Trump, however, gasoline prices shot up as soon as the Iranian war began and on November 3, are almost certain to be substantially higher than they were in 2006 (after adjusting for inflation). Trump promised $2 gasoline but Americans are currently paying $4.46 a gallon.
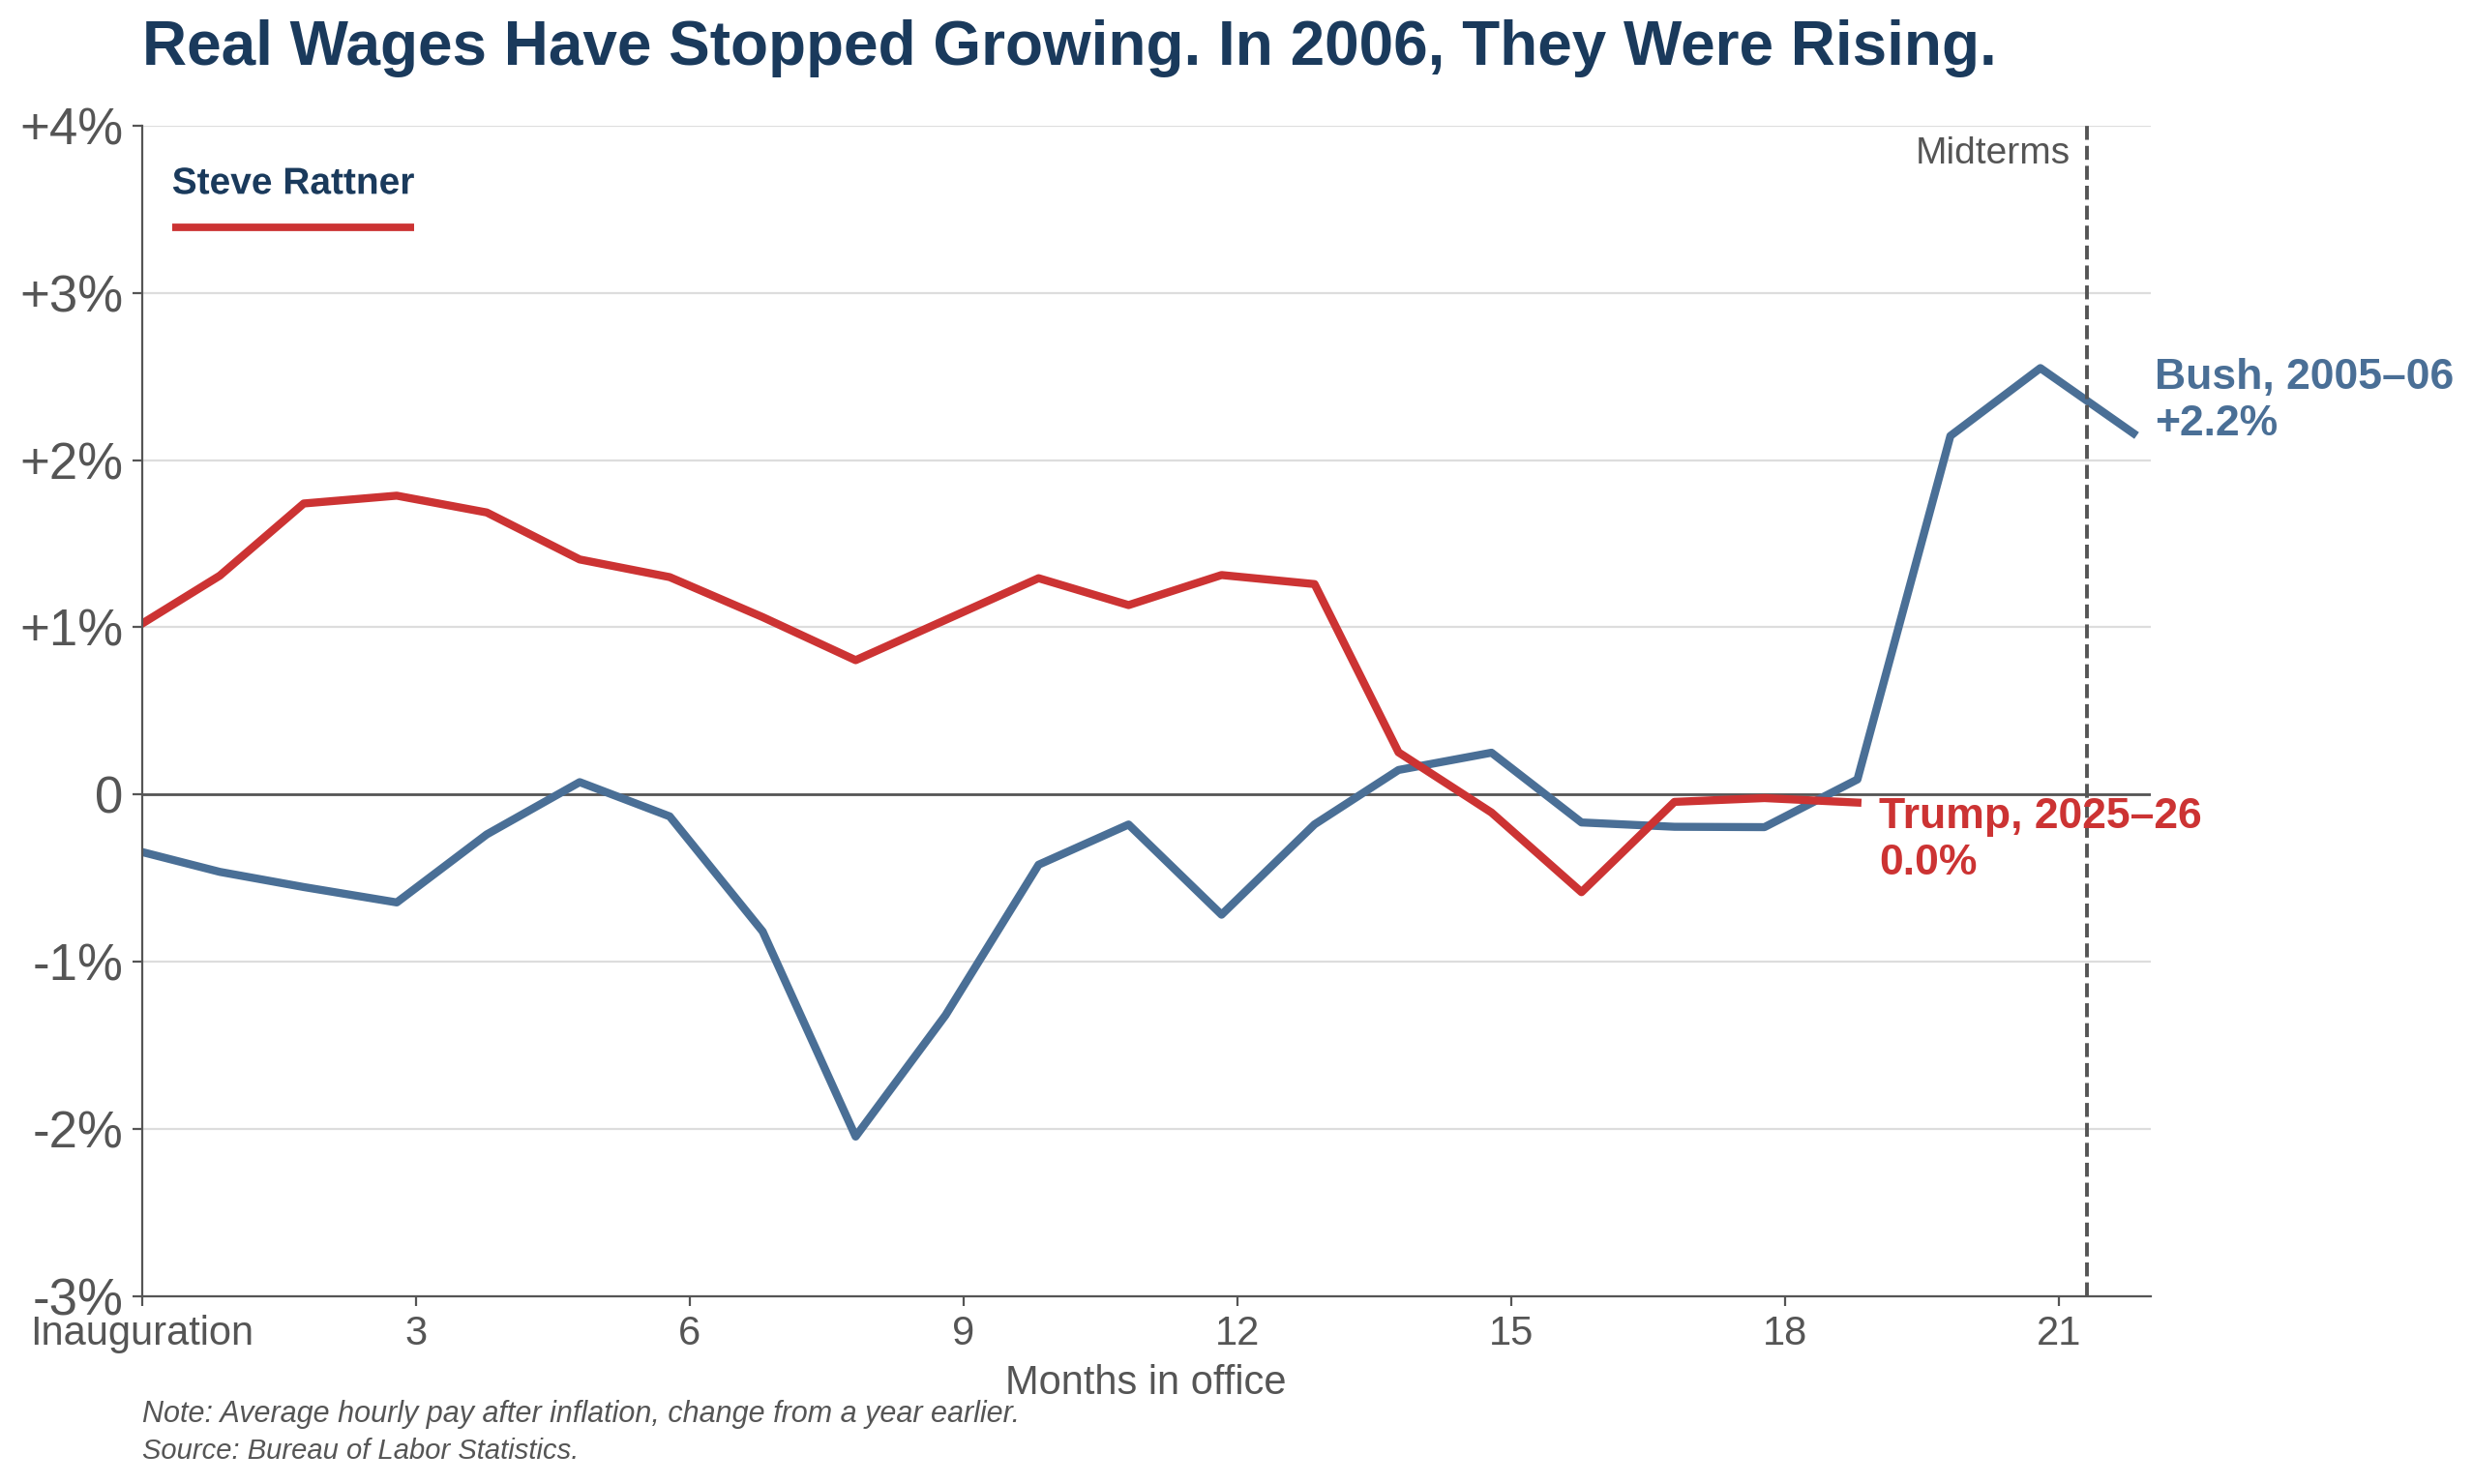
Oil prices have been a significant contributor to the overall increase in inflation this year. Rising prices have cut into workers’ purchasing power and have completely offset the wage increases that Americans achieved over the past year. That’s the opposite of what happened in the first 21 months of Bush’s second term. Inflation-adjusted wages fell in 2005 after Hurricane Katrina pushed up gasoline prices, but they rose sharply in the months before the election as pay rose and the inflation rate declined.
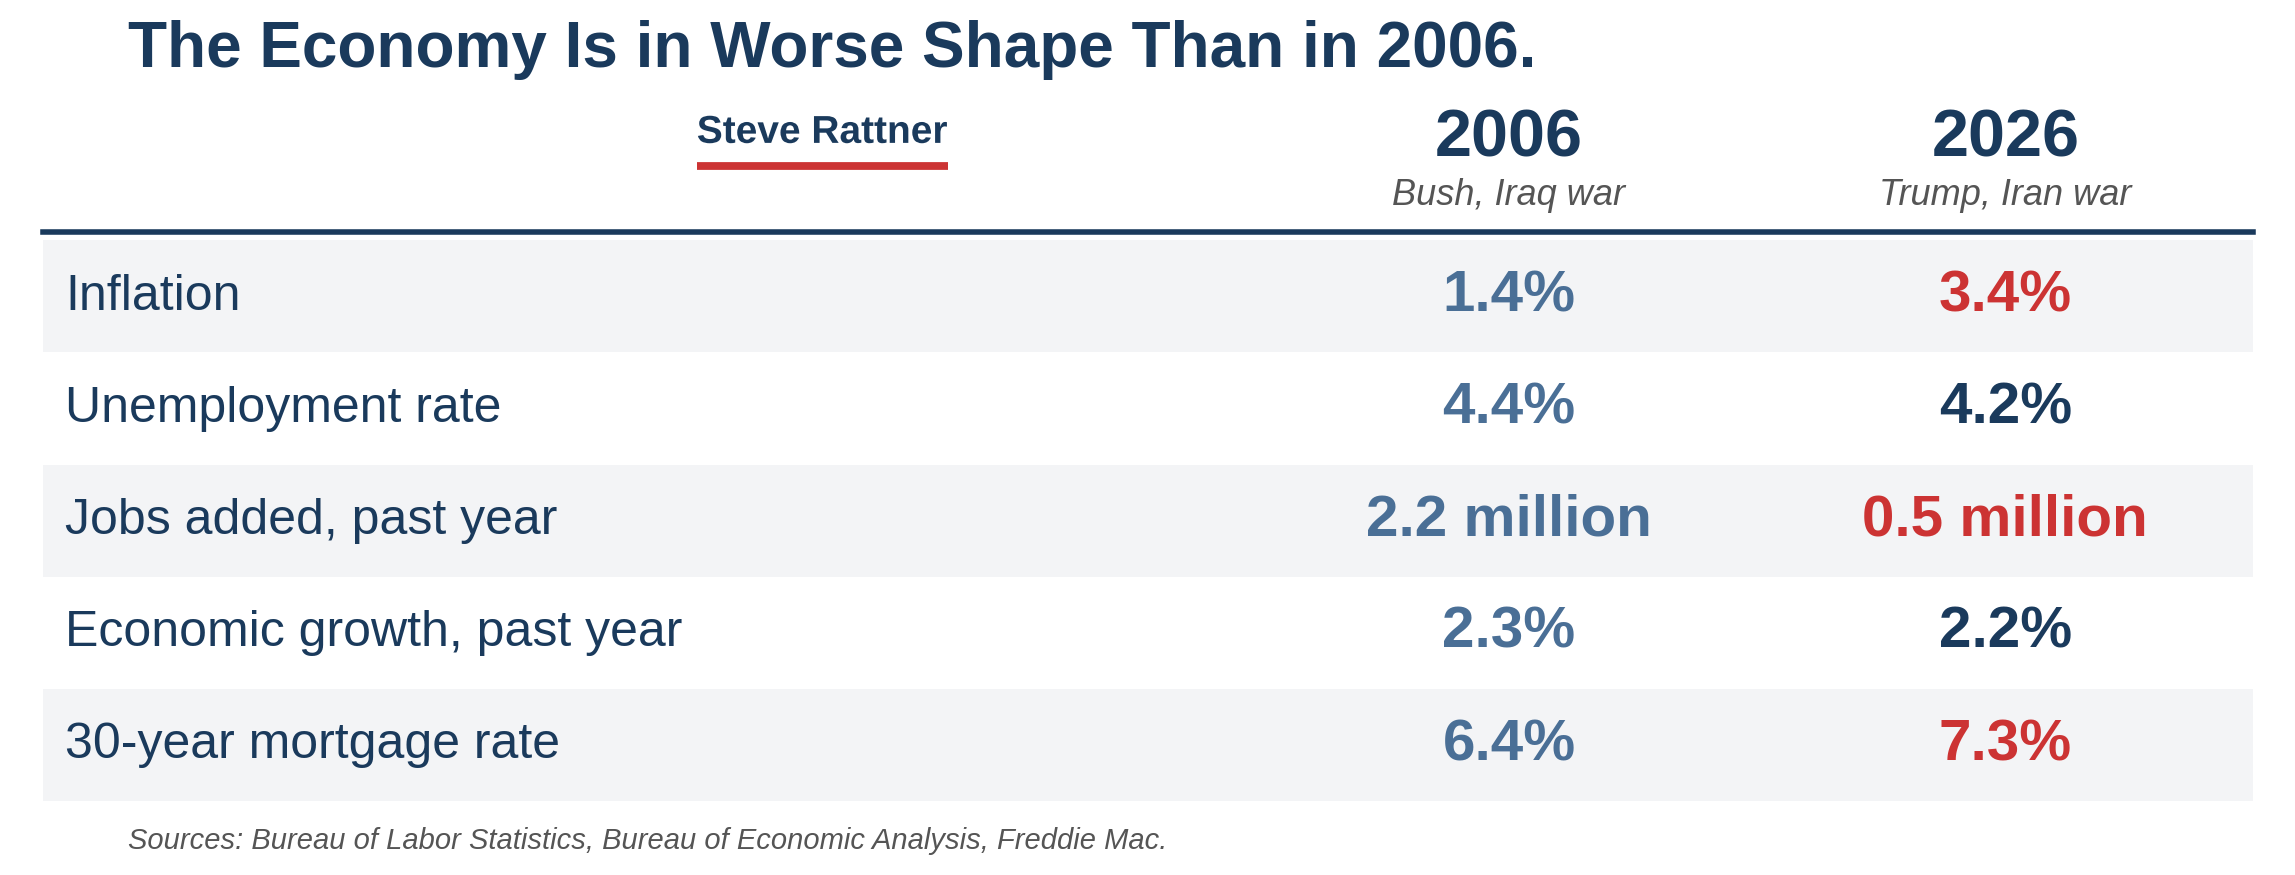
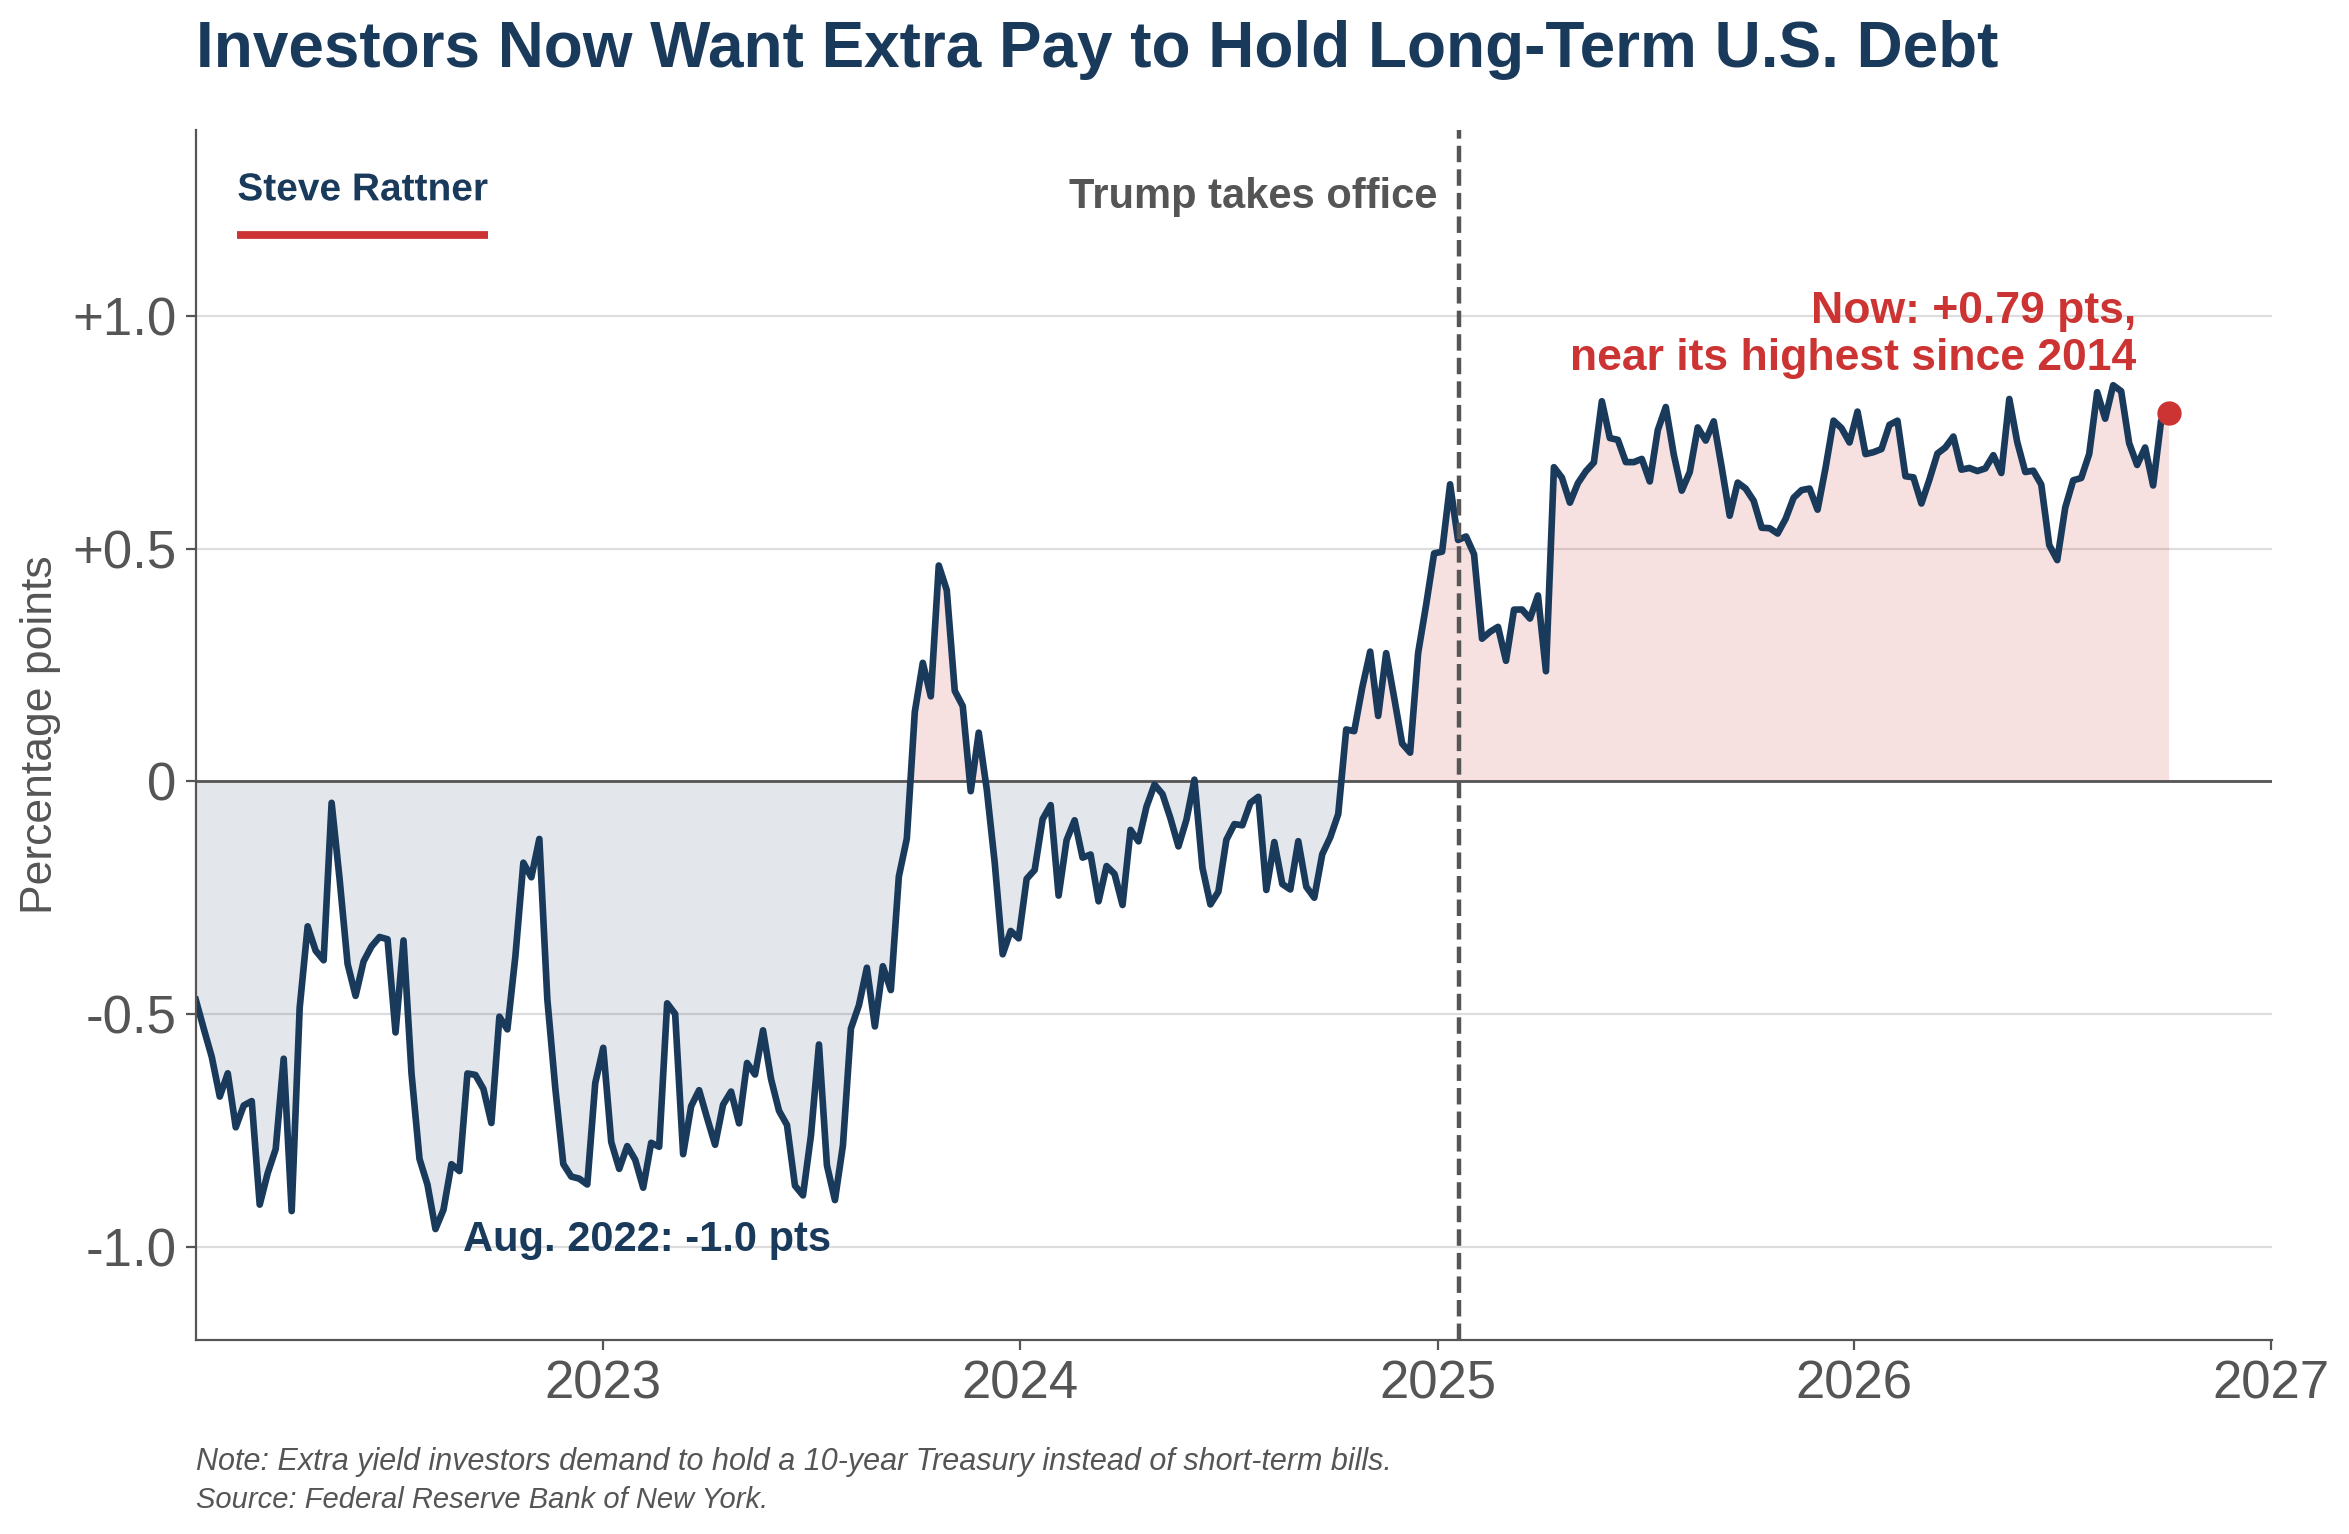
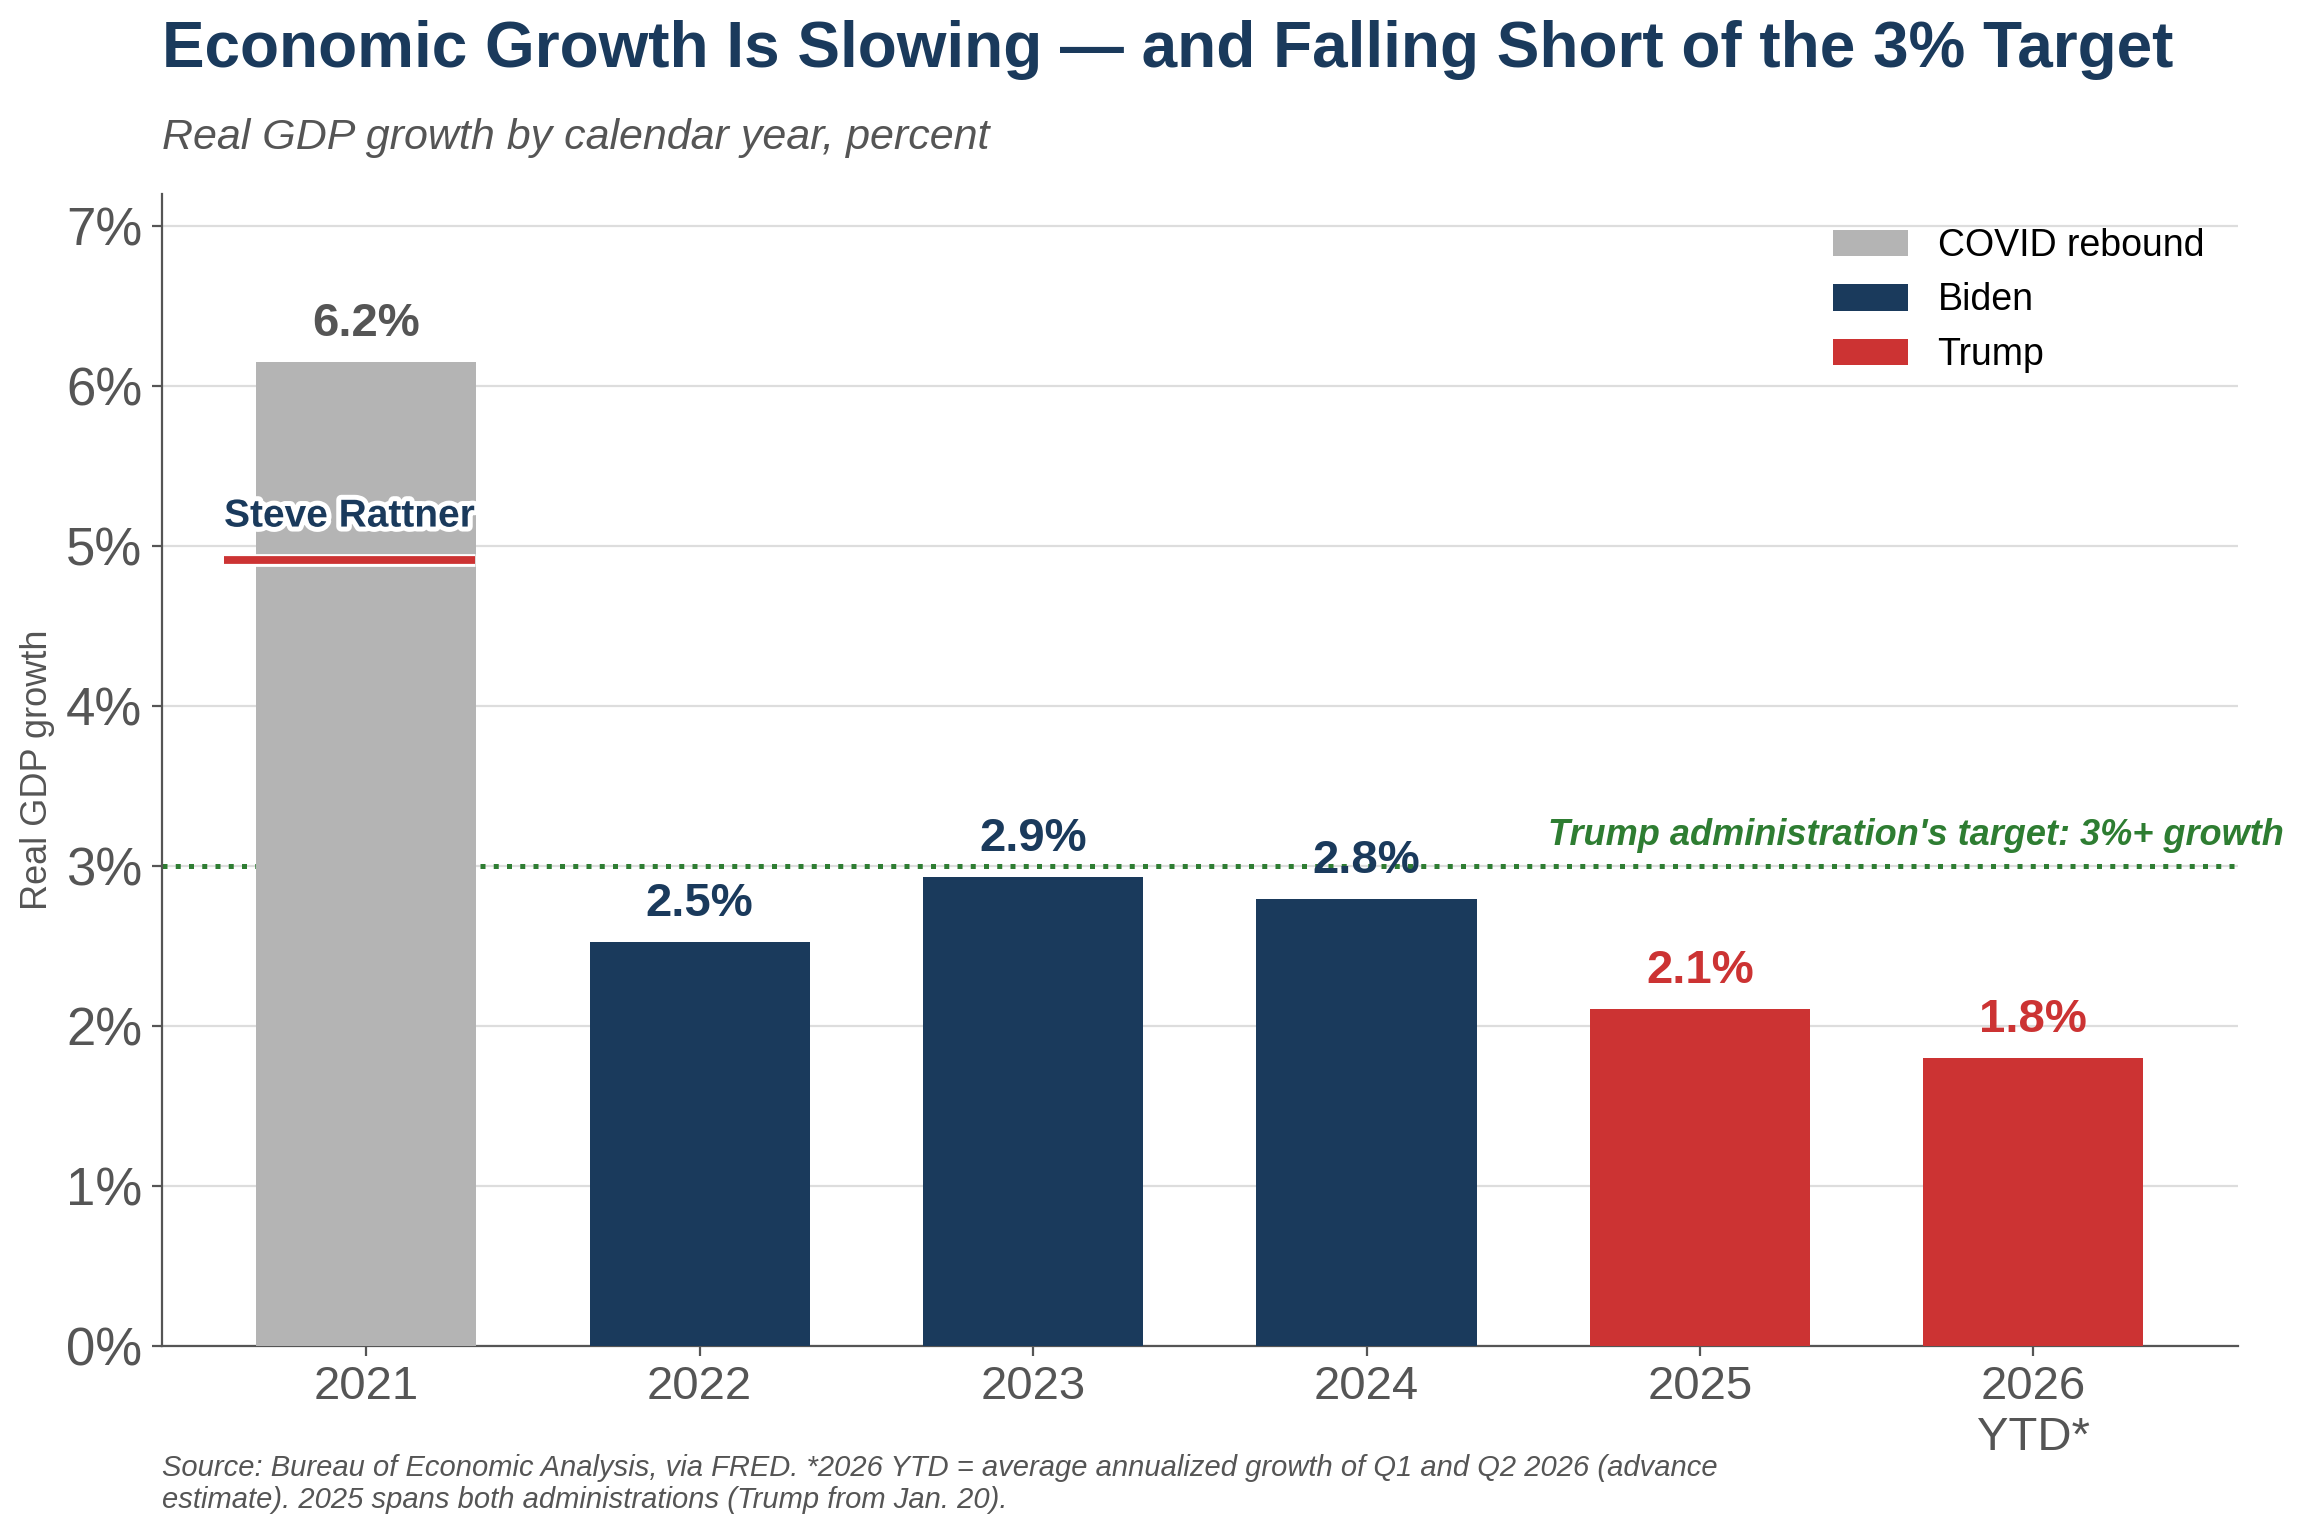
Most — although not all — other economic indicators are still tilted against Trump. At 3.4%, the inflation rate is more than double Bush’s 1.4%. And while the unemployment rates are similar, Trump has added just 500,000 jobs in the past year, compared to 2.2 million for Bush in the year before the 2006 election. Economic growth has been comparable across the two periods but mortgage rates — another thorn in the side of consumers — are substantially higher this year than they were 20 years ago (7.3% versus 6.4%).
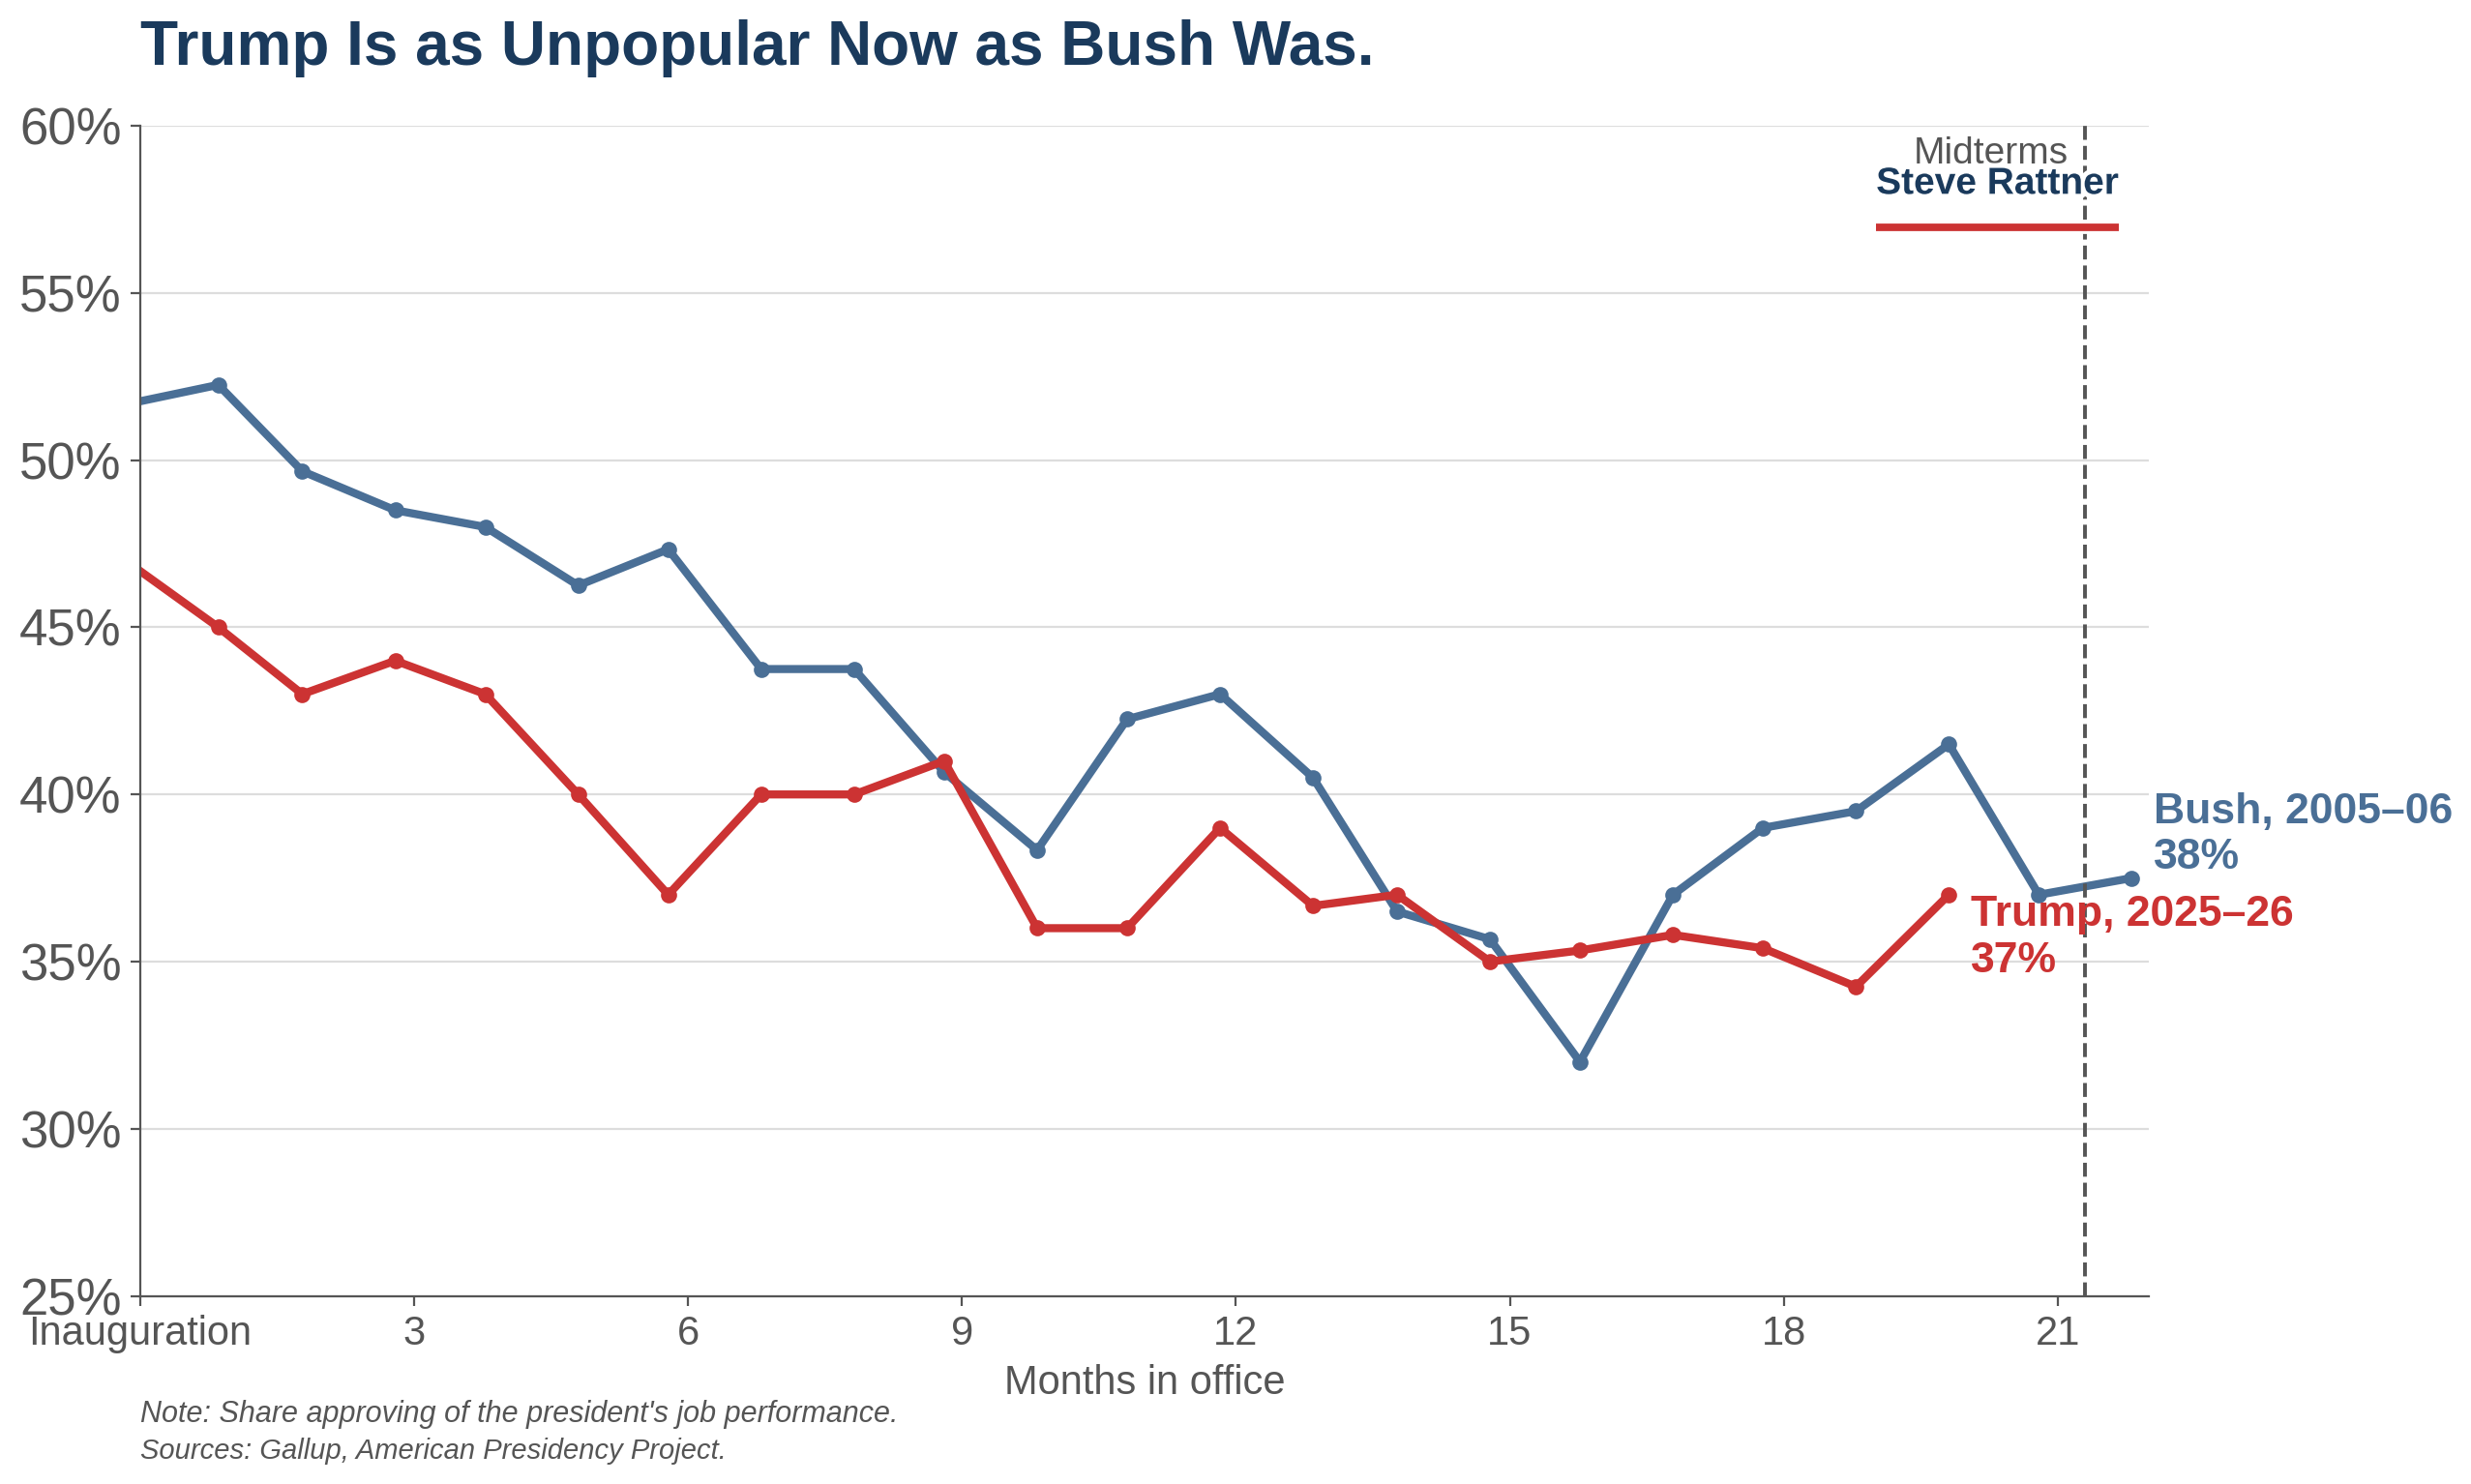
That economic data caused both presidents to suffer from declining popularity at very similar rates. Unlike Trump, Bush began his second term just above the 50% mark, a level Trump has never attained in his second term. And while Bush’s popularity reached a low of 31% in May 2006, by Election Day, Bush had an approval rating of 38% versus Trump’s current 37%.
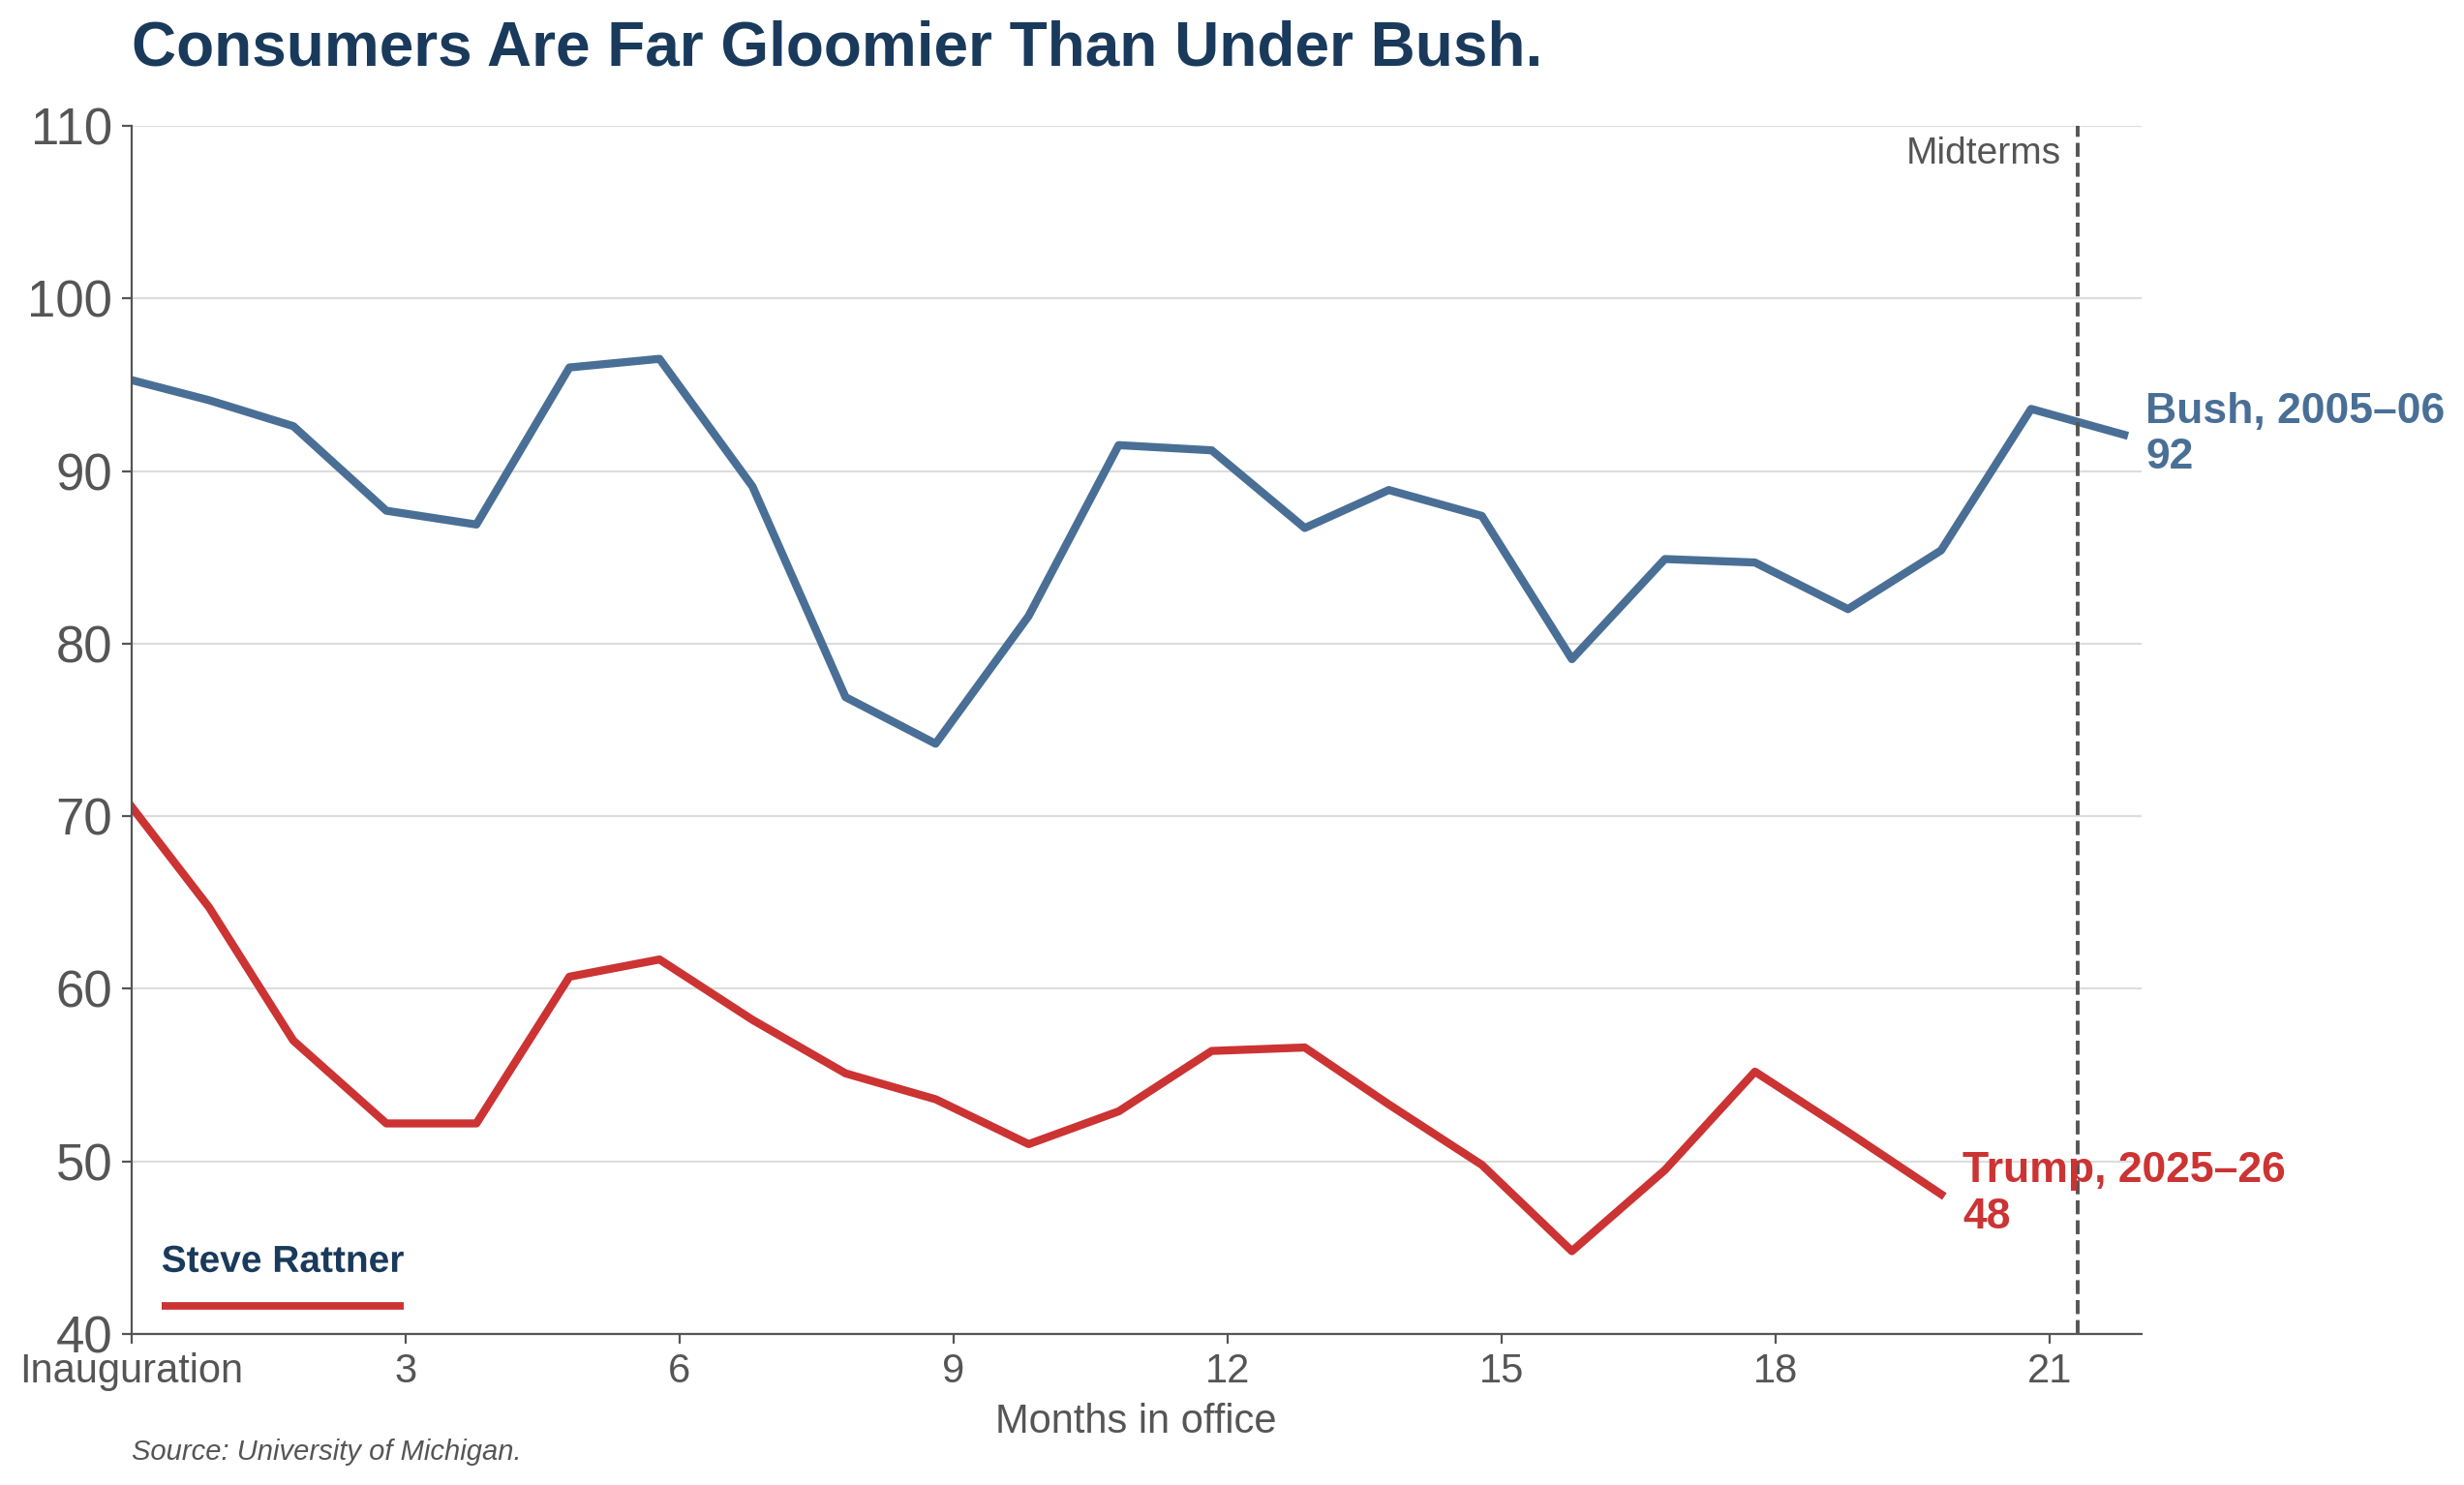
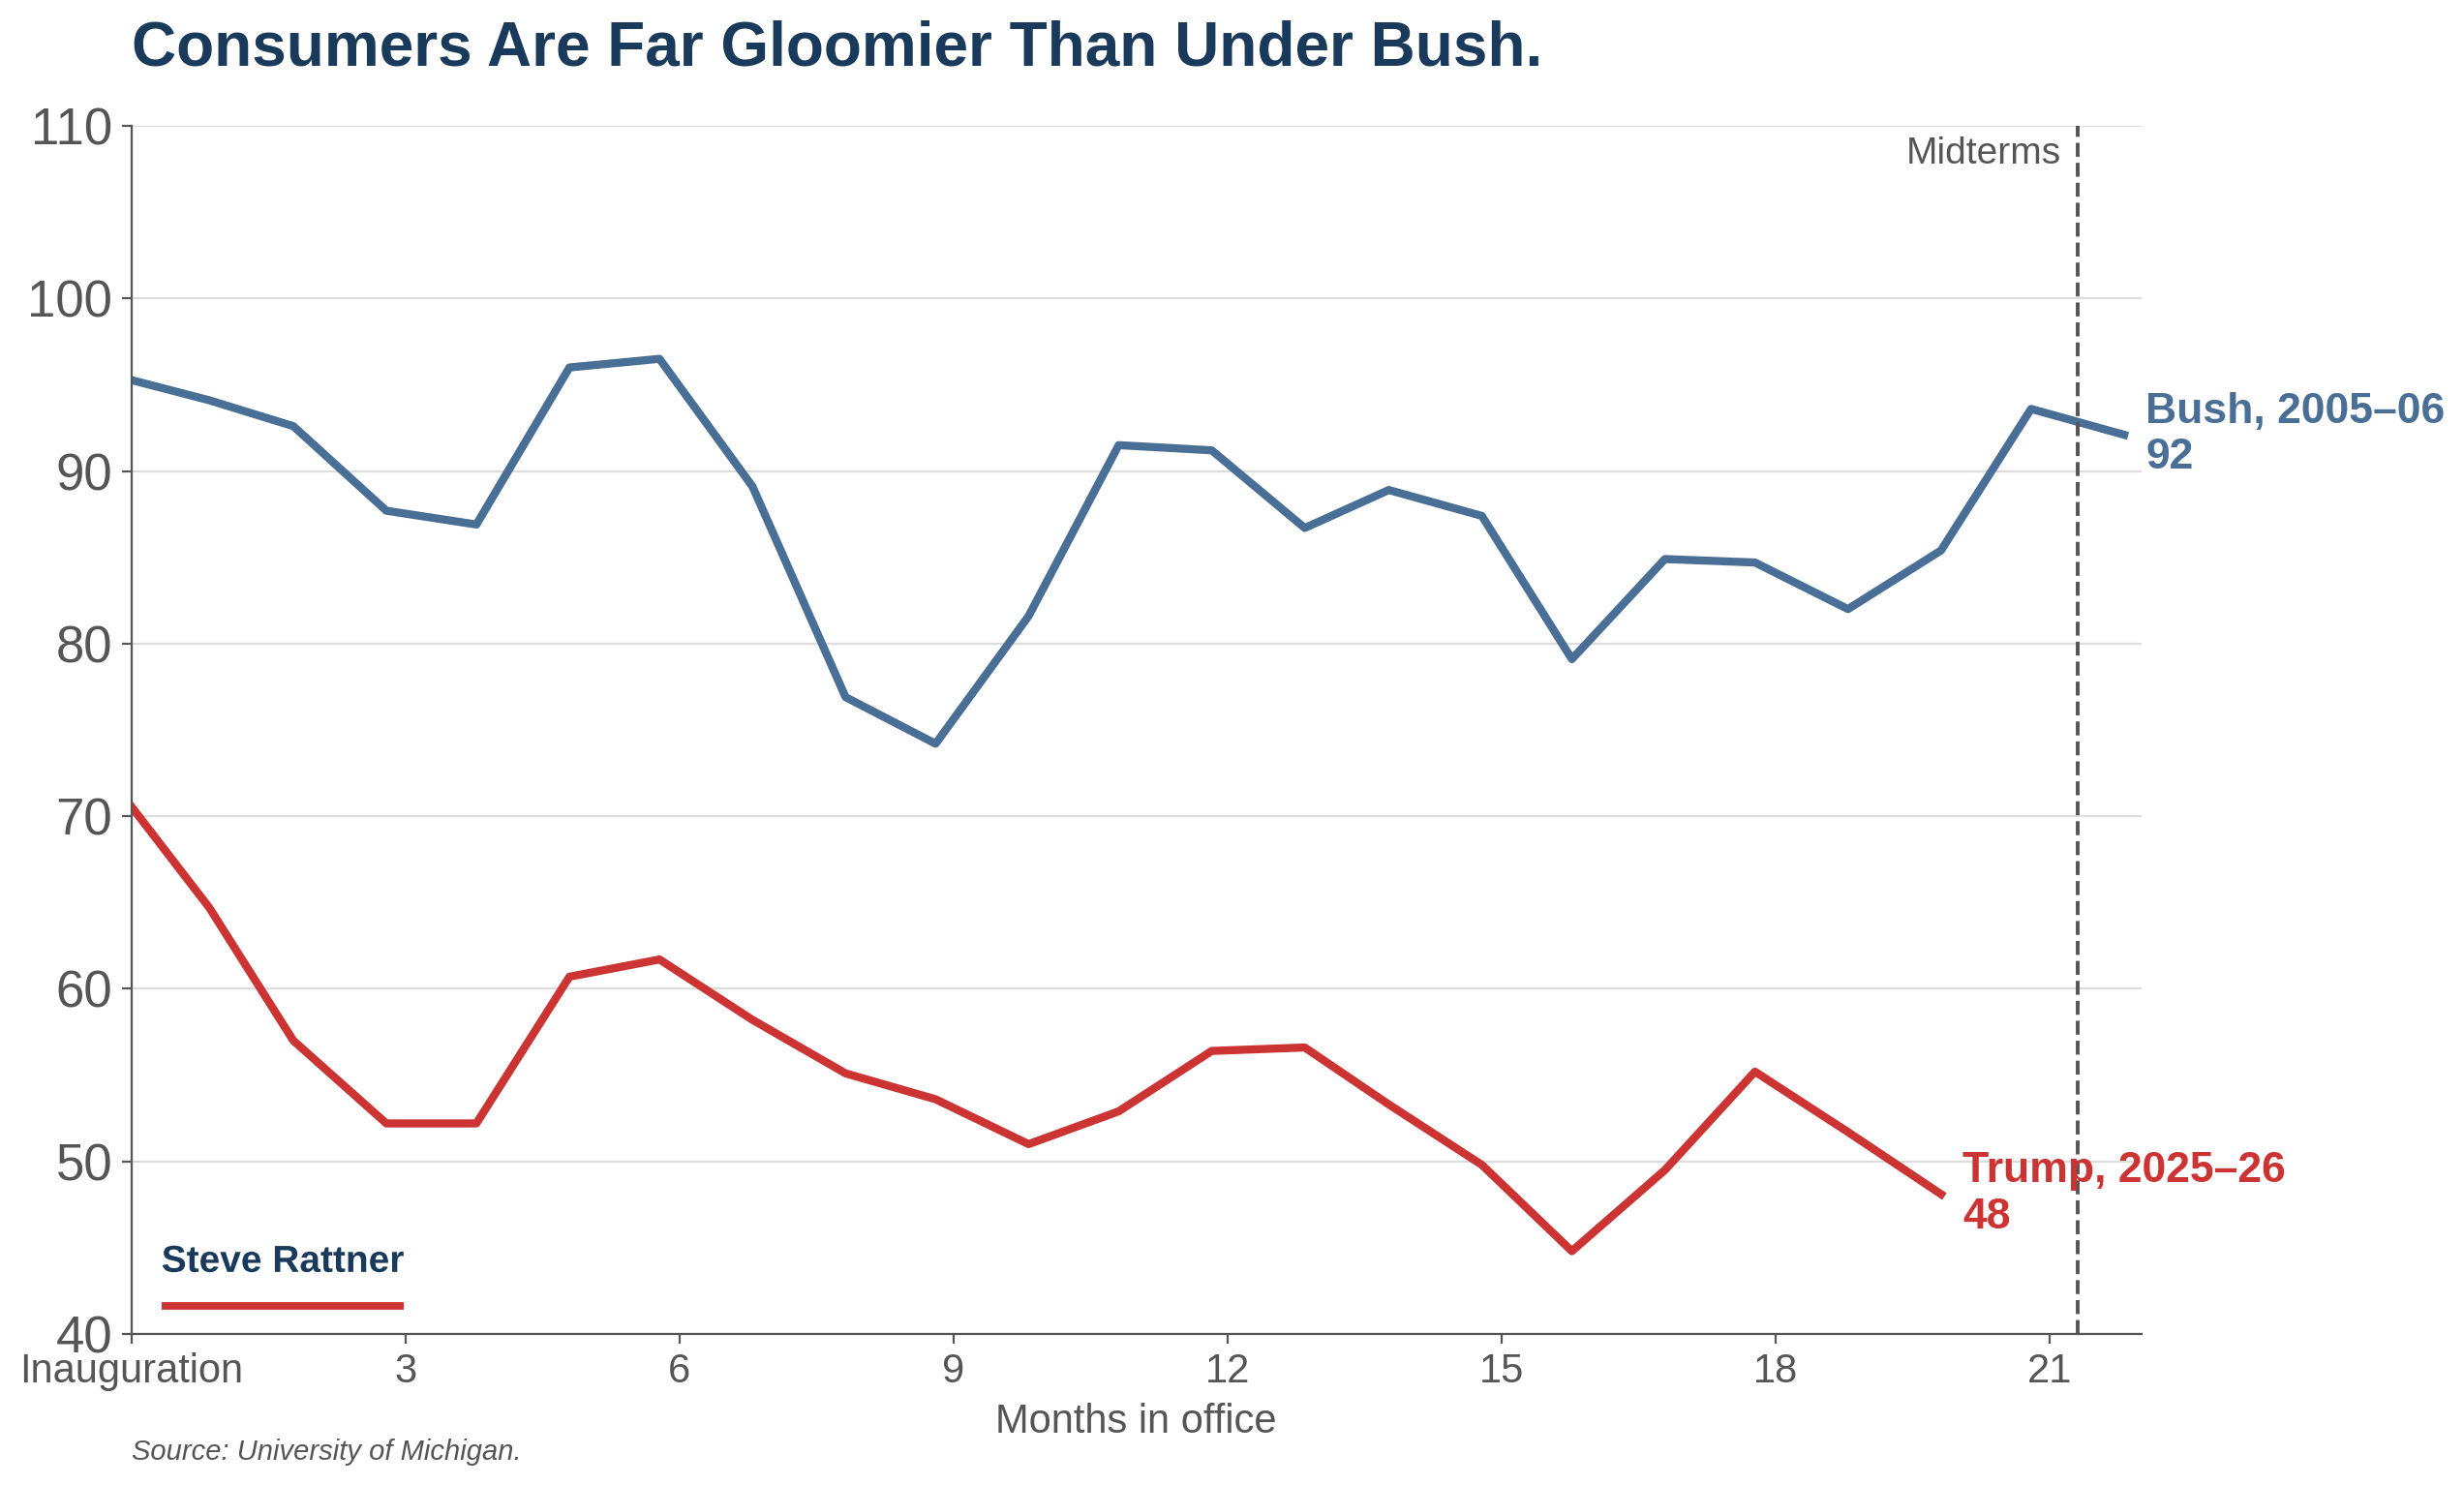
The most striking difference between the state of the country across the two periods is in the mood of consumers. Under Bush, consumers were relatively sanguine and, apart from a dip after Hurricane Katrina, remained so from Inauguration Day to Election Day. Under Trump, Americans began 2025 far more pessimistic and that pessimism has only grown since then. Among the differences between the time periods has been the tariffs; consumer sentiment took a particularly sharp fall around Liberation Day. Another difference is the chaos and corruption of the Trump era, which, while not directly economic matters, may be affecting Americans’ moods.
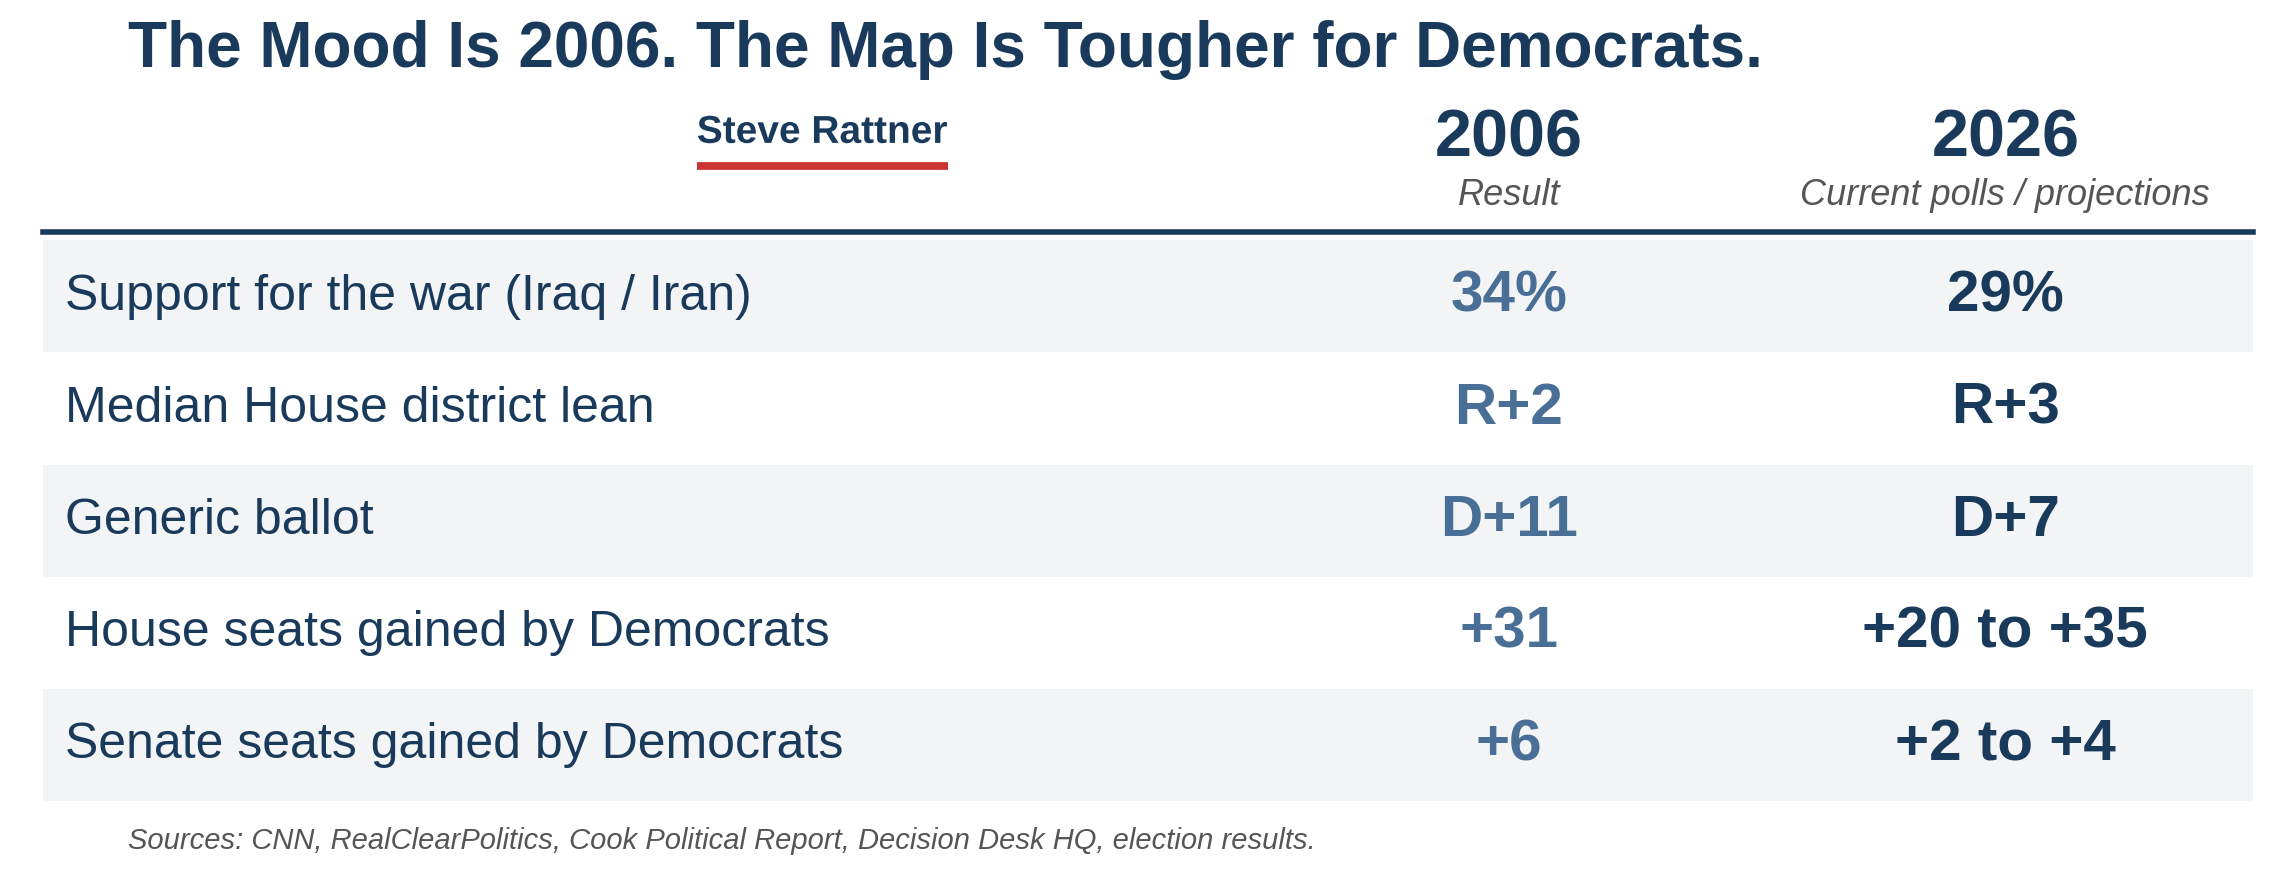
Another important non-economic factor is the war and here again, Trump is at a disadvantage, albeit a small one. On the other hand, the redistricting that Republicans forced through in a number of states this year has raised the longstanding Republican advantage in the median district, to R+3 from R+2 in 2006. Experts believe that this could add a net Republican advantage of about four House seats. Also important to note, the number of swing seats (those that are plus or minus 5 points) has dropped to about 80 from 108 in 2006, reducing the number of seats that would likely flip even in a wave election.
Perhaps the best news for Trump is that the current polling average for a generic ballot gives Democrats an advantage of 7 points. In 2006, they held an advantage of 11 points.
All told, Democrats added 31 House seats and 6 Senate seats in 2006. Current estimates are for Democratic additions of 20 to 35 House seats and 2 to 4 Senate seats.