On MSNBC’s Morning Joe today, Steven Rattner highlighted the key takeaways of President Biden’s latest fiscal proposal, explaining just how much of the American Jobs Plan would go toward infrastructure and contextualizing how such spending compares to recent history.
President Biden unveiled yesterday the largest, most sweeping government spending plan in at least 50 years. What’s in the American Jobs Plan, do we need it and what does it mean for the future size of the federal government?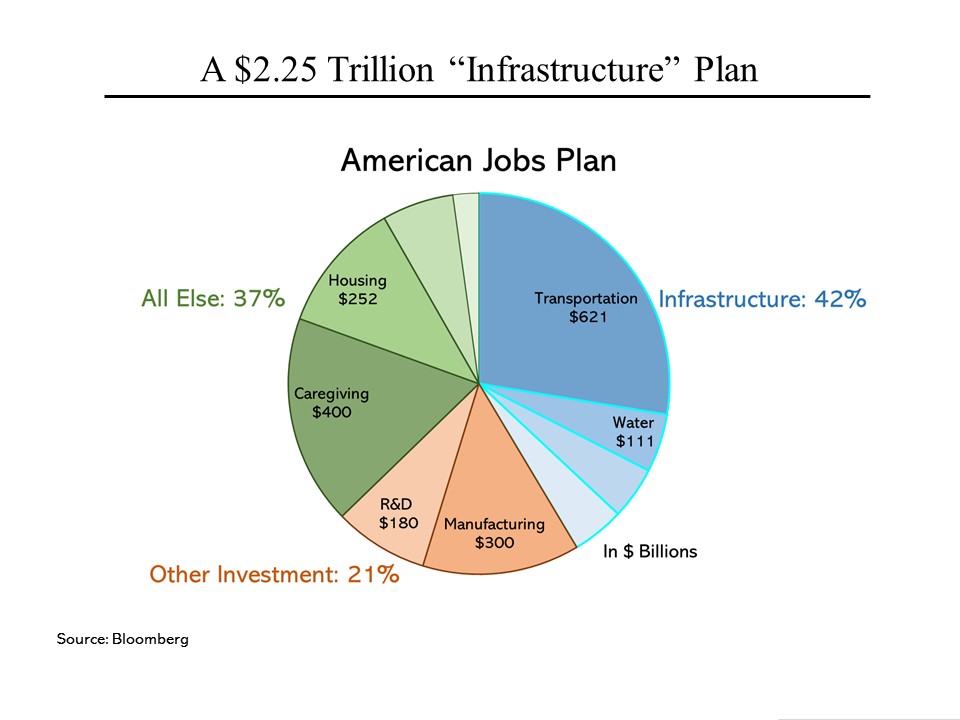
While the proposal has been widely described as an “infrastructure plan,” in reality, it’s much more – just as the previous Biden package (the American Rescue Plan) was much more than a Covid relief package. Many, many details of the latest proposal have yet to be unveiled but based on the almost 30-page White House fact sheet, it appears that roughly 42% can be reasonably described as infrastructure and another 21% falls more or less into the category of other investment, which leaves over $800 billion as “other.” Included in this last bucket is $400 billion for affordable care for the elderly and those with disabilities (with no specificity as to how this money will be expended).
Congress will have much to chew on in this package and in a perfect world, discipline will be imposed to be sure the money is spent wisely.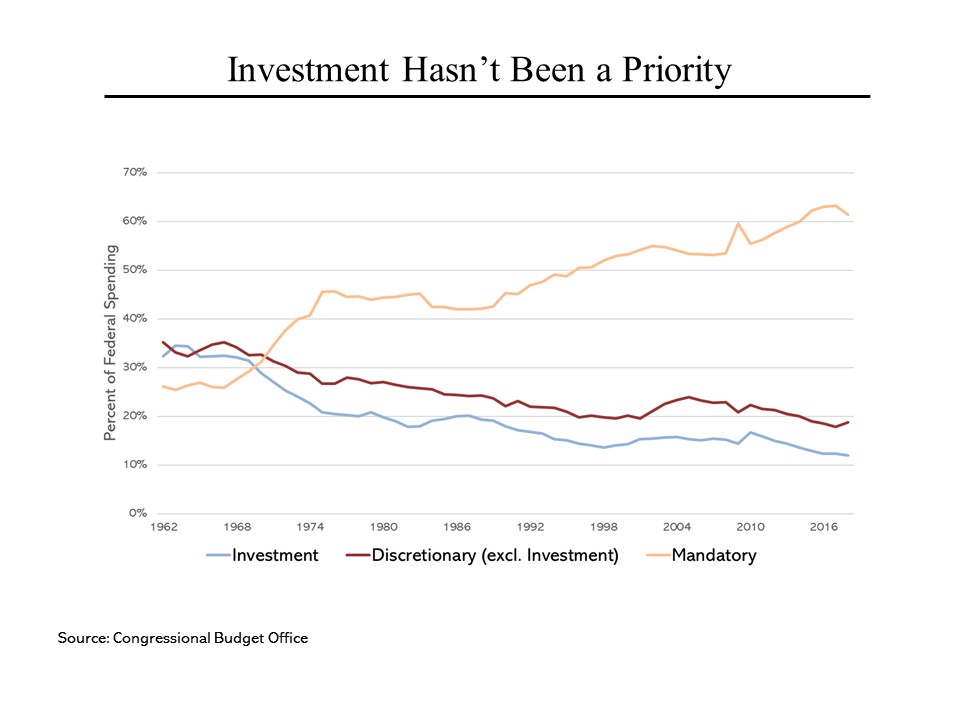
That we need to do something to improve public investment is not in doubt. Federal spending on infrastructure, research and development and similarly important investment activities has been declining steadily both as a share of total federal spending and also as a share of gross domestic product. That’s largely because the increasing cost of Social Security, Medicare and related programs – together with the overall pressure (at least until recently) to keep government spending under control – has squeezed down the amount of money available for everything else Washington is supposed to do. Even within what is known as “discretionary spending,” investment-related expenditures have been deprioritized in favor of more current needs.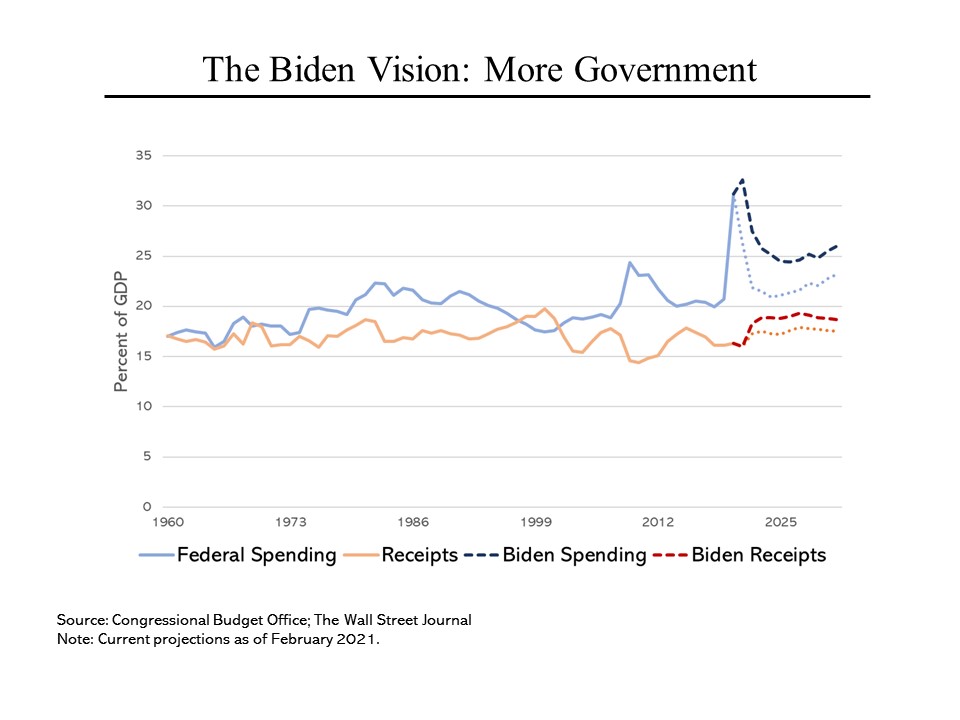
No one should be confused about what the Biden administration programs would do to the size and scale of the federal government. For decades, the amount of federal spending bounced along at around 20% of GDP – a little lower during the late 1990s boom and a larger, but brief, uptick around the financial crisis. Covid changed that, at least temporarily, but the two plans from Mr. Biden would keep spending at 25% of GDP or more for the indefinite future. That’s a fundamentally different role for Washington.
Meanwhile, taxes, which have stayed within an even narrower band of 15% to 20% would remain there, creating the prospect of large structural deficits of more than $1 trillion indefinitely. (Note that this chart is based on Mr. Biden’s campaign proposals but they remain consistent with the proposals that he has been rolling out since the inauguration.)