On Morning Joe today, Steven Rattner explained the macroeconomic context of the UK’s current turmoil. Below are three supporting charts:
With the pageantry and tradition of the passing of Queen Elizabeth in the rear view mirror, the United Kingdom is now fully engaged in dealing with its most tumultuous episode of both political and economic turmoil since the 1970s – with the two inevitably being closely related. The new prime minister, Liz Truss, who has been in office for less than two months, has already had to fire her Chancellor of the Exchequer and walk back most of her economic plan. While the repercussions of Brexit may be playing a short-term role, Britain’s economic challenges go back to well before the country chose to leave the European Union.
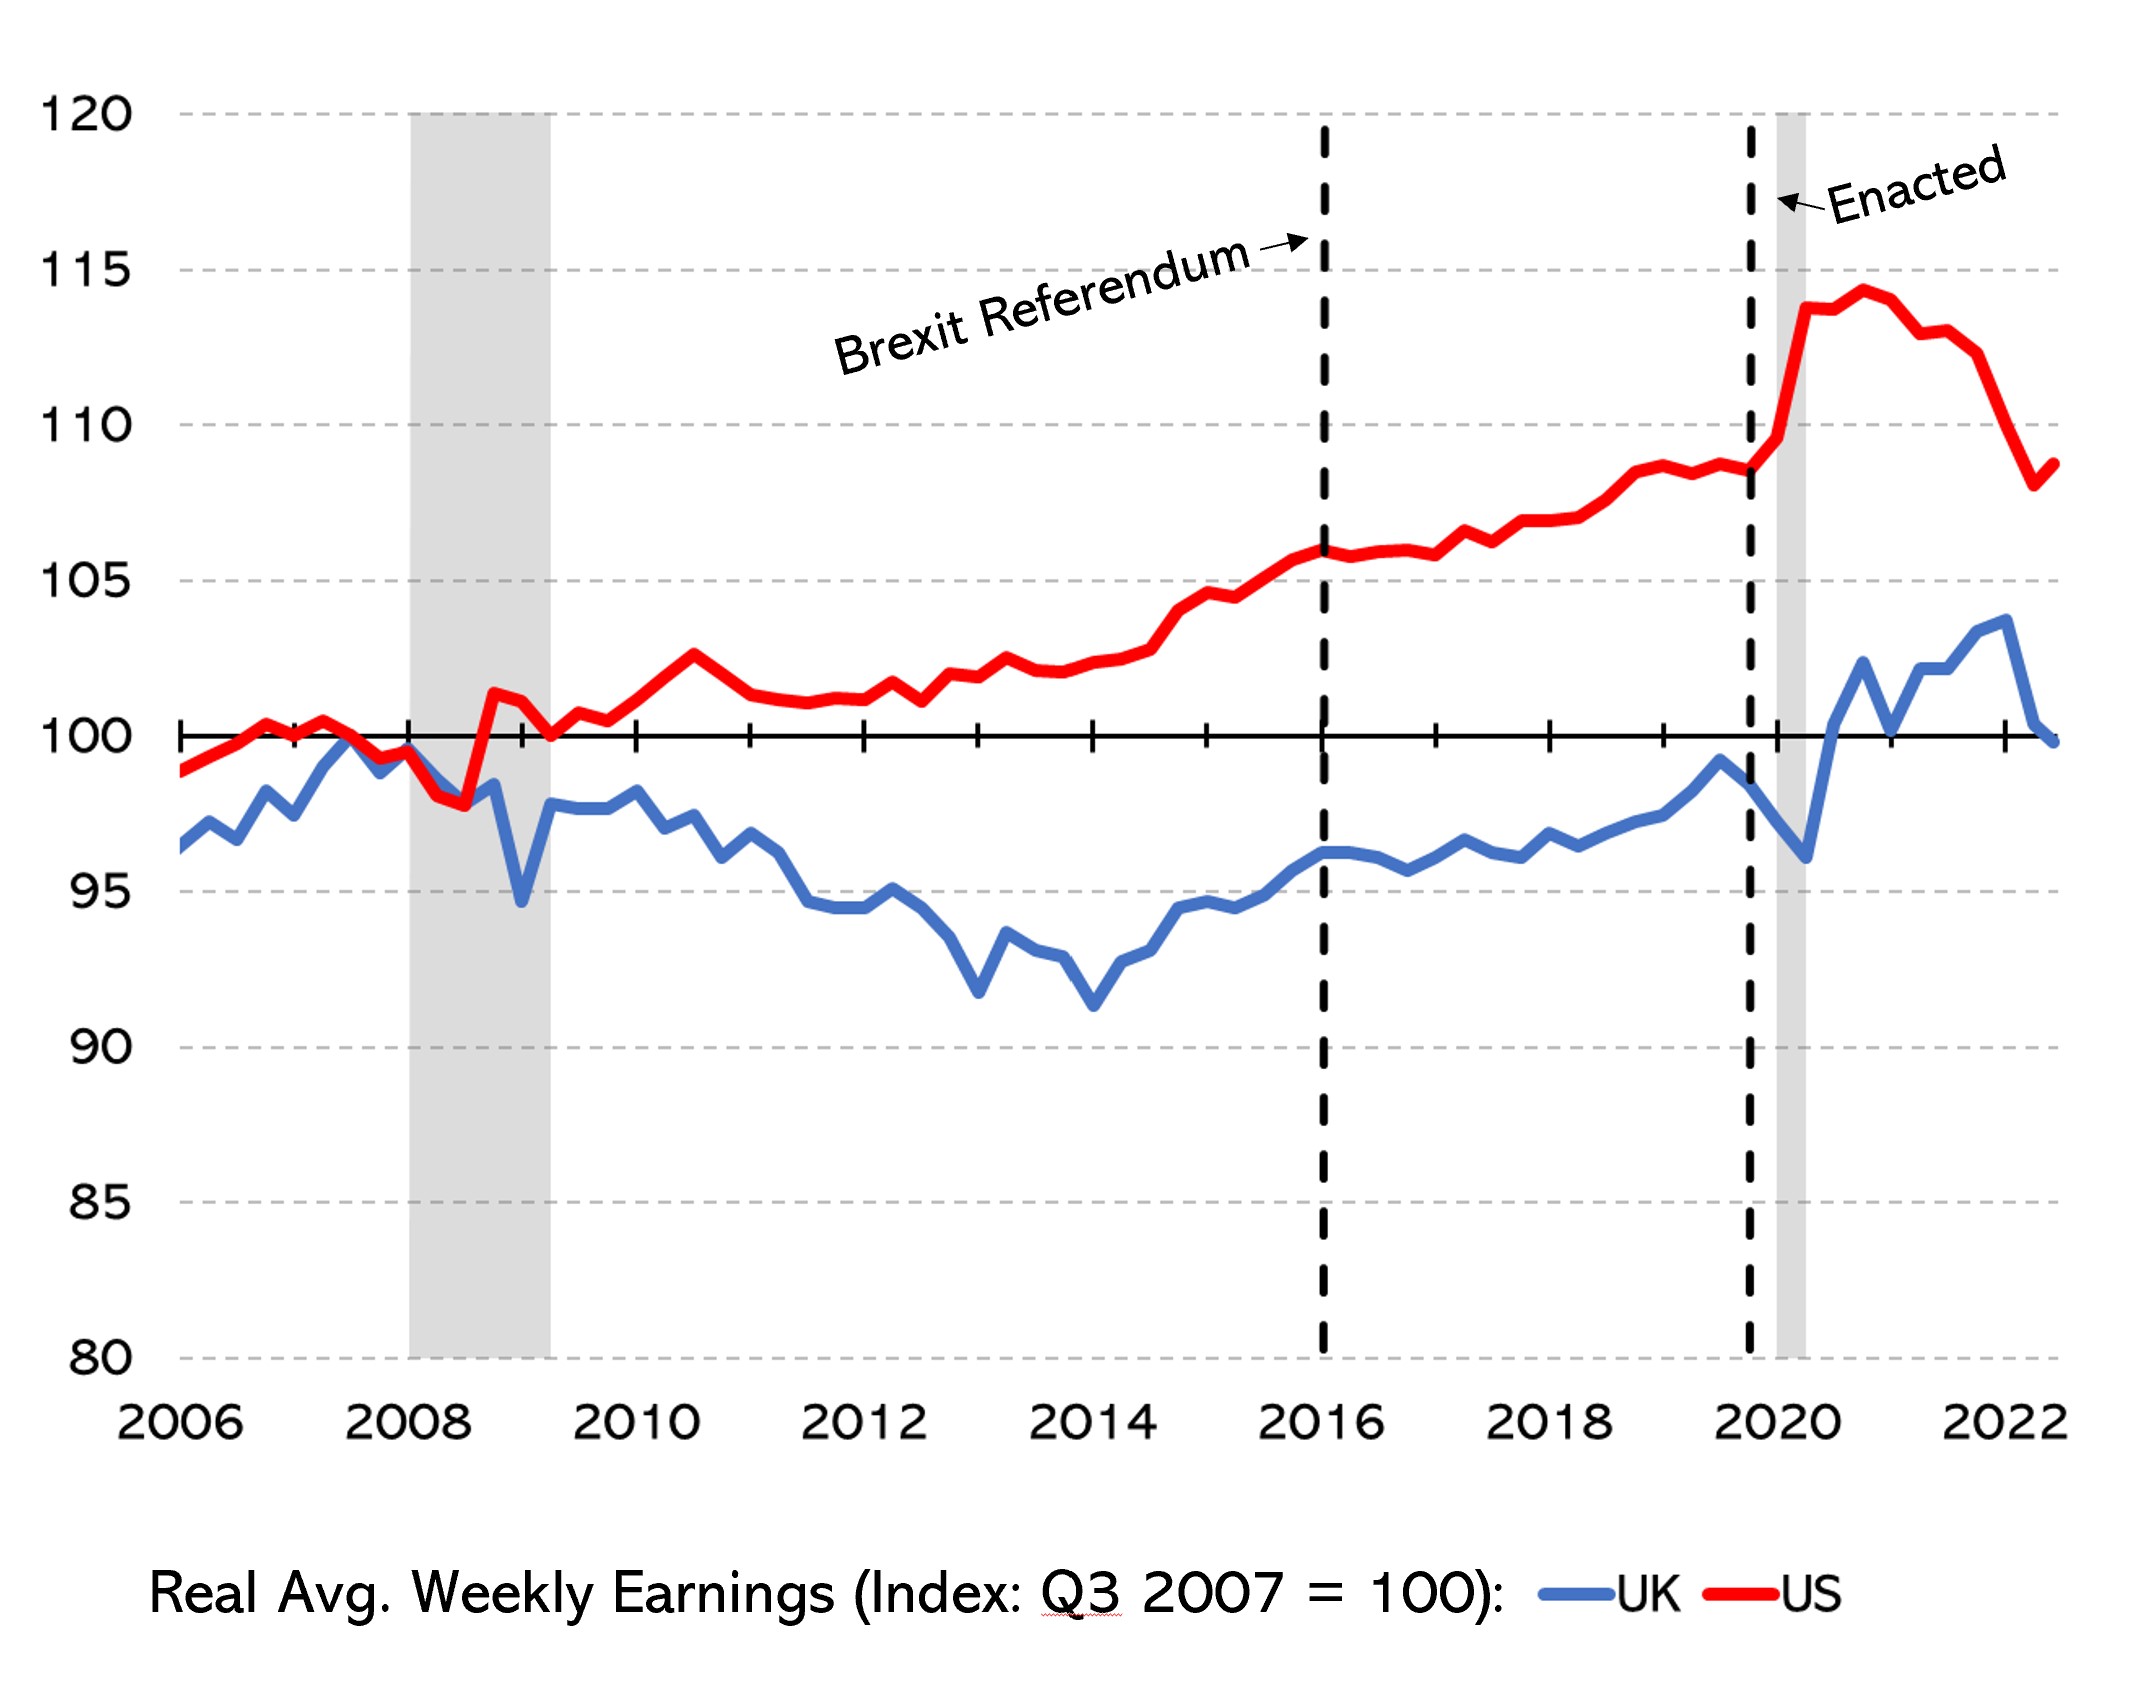
Central to Britain’s economic struggles is its poor economic performance, manifested perhaps most tellingly in the bedraggled state of British workers, whose average earnings after inflation have performed poorly since the financial crisis struck more than 15 years ago and are now no higher than they were at the end of 2007. While other developed nations have had challenges during this period, Britain’s stand out. Before inflation took its toll, real wages in the United States had grown about 15% over this period; today, our workers still earn about 8.6% more than they did (after adjusting for inflation) before the financial crisis. Real wages in the UK saw strong growth in the UK before the GFC: 2.7% per year. Now, in real terms, UK workers earn the same as they did in 2007. That’s 0% growth over 15 years.
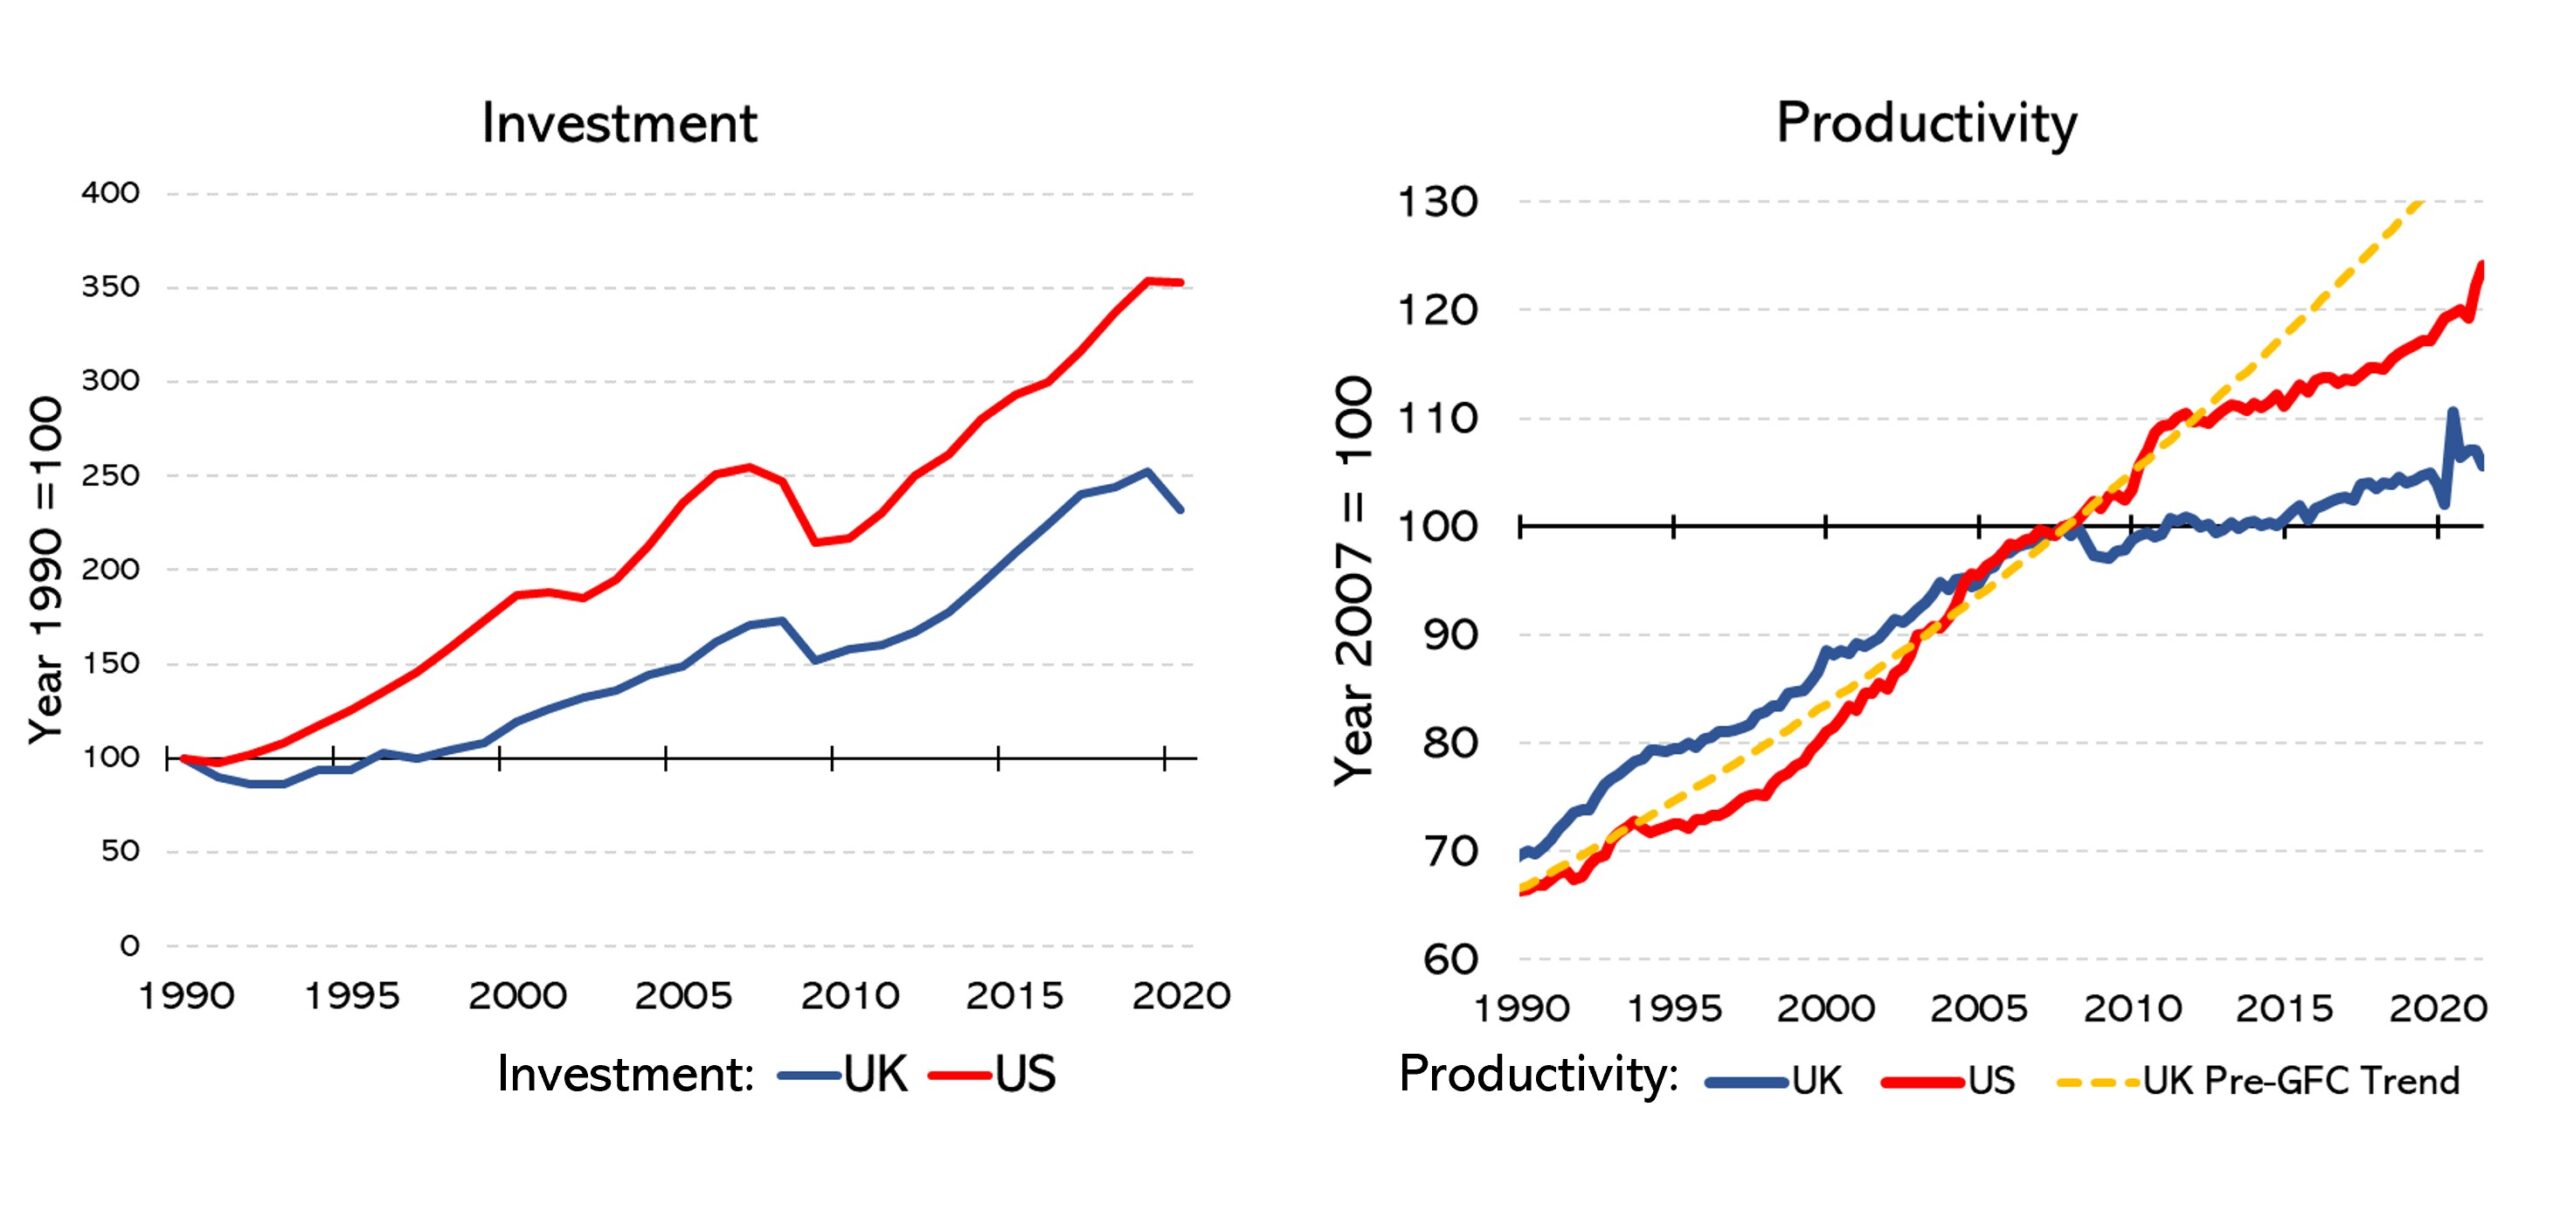
At the heart of that divergence is the poor record of investment into the U.K., which ultimately translates into poor productivity, the amount of output generated by each worker. In the long run, improving productivity is the only way to generate sustained economic growth and higher earnings for workers. The United States has also been having its productivity challenge, but output per worker in the U.K has barely grown in the past 15 years. Today, output per British worker is only 5.6% higher than in 2007 – compared to 24% higher in the US.

That poor record of productivity growth has translated into a subpar economic performance. In 2005, the UK had a GDP per capita 95% of Germany’s — compared to just 86% now. The growth in the size of the economy on a per capita basis has substantially lagged that of not just the United States but also that of Germany (and many other countries.) Overall, UK GDP grew an average of 2.8% per year in the 15 years prior to the financial crisis — compared to just .83% per-year in the 15 years since.