On MSNBC’s Morning Joe today, Steven Rattner charted the significant household wealth increases in 2020, a year in which many suffered while others – particularly the wealthy – prospered.
Last year, even as the nation suffered through a pandemic, an exceptional amount of wealth was created – but hardly evenly across income and racial groups, according to recent data from the Federal Reserve. Indeed, the 10% increase in wealth created last year ($11 trillion) was remarkably similar to the 12% increase the previous year when there was no pandemic underway.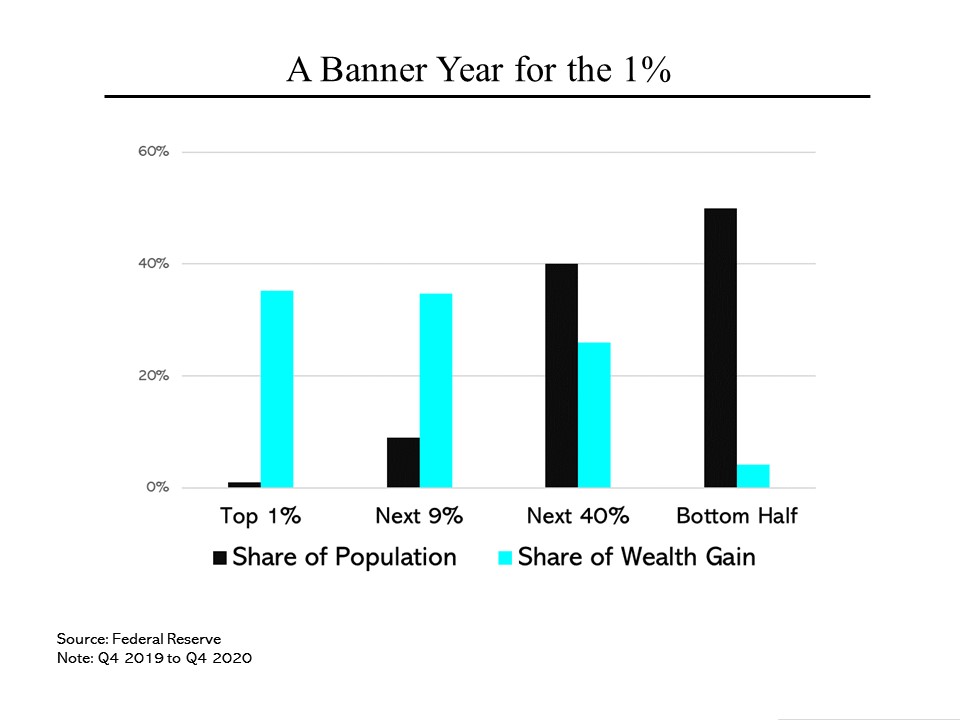 Of the $11 trillion in wealth created, the top 1% of households — that small sliver of the population – garnered 35%. Coincidentally, that’s almost exactly the share of new wealth achieved by the next 9% of households. So each of those households only saw its net worth go up by one ninth of what the wealth of the top 1% increased by. Putting it another way, more than 70% of all the wealth generated in 2020 went to the top 10% of Americans. From there, the news only gets worse. The next 40% of households received 26% of new wealth, while the bottom half – 50% of all Americans – only had a 4% share in wealth created last year.
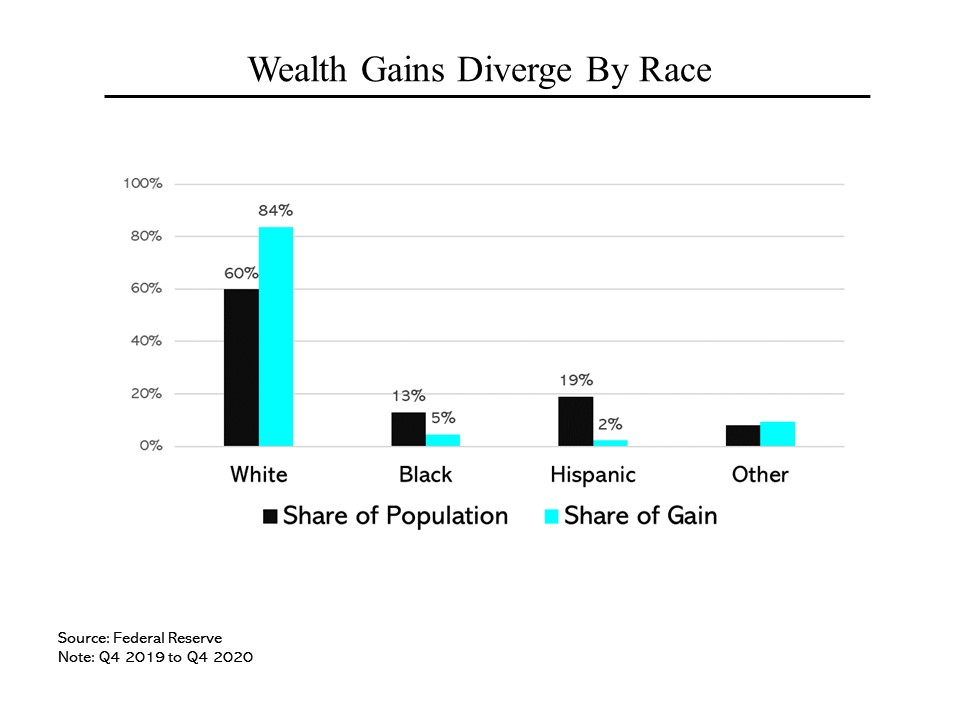 Looked at by race, the news isn’t good either. White Americans, who represent 60% of the population, had an 84% share of the wealth increase, while Blacks, who comprise 13% of the country, only had a 5% share of additional wealth. Hispanics fared even worse, with just a 2% share, despite comprising 19% of the population.
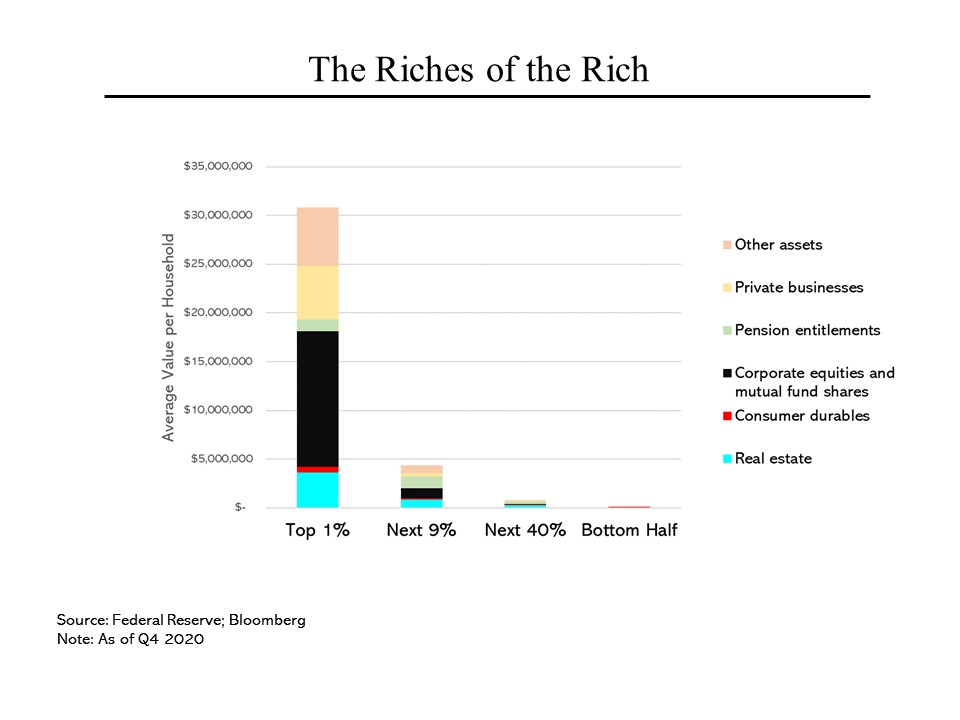 So where did that leave each income group in total wealth at the end of 2020? For the top 1%, the average household assets totaled more than $30 million. Yes, that number sounds extraordinary but remember that as an average, it is skewed by the presence of so many billionaires, some with fortunes in excess of $100 billion. But even the least wealthy of the 1% are doing fine; according to the latest Knight Frank Wealth Report, the “poorest” of this 1% still had a net worth of $4.4 million. These ultra-high net worth Americans spread their holdings across a variety of asset classes. On average, they had $3.6 million in real estate, $14 million in financial instruments like stocks, and $5.5 million in private businesses.
The next 9% of households had an average net worth of about $4,000,000, spread among real estate, stocks and pension entitlements. Once you get below the top 10%, the numbers get depressingly small. The next 40% of Americans had an average net worth of $680,000 while the bottom half – 50% of all Americans – averaged just $39,000.