On MSNBC’s Morning Joe today, Steven Rattner reviewed a suite of indicators that all paint a similar picture: the resurgence of COVID-19 cases and lack of stimulus is taking a renewed toll on the economy.
President-elect Joe Biden issued a strong call yesterday for another round of economic stimulus – and the evidence suggests that he was right to do so. Promising news about Covid vaccines has energized the stock market but in the shorter term, early signals indicate that the surge in infections may be having a near-term impact on our economy. Congress needs to act quickly.
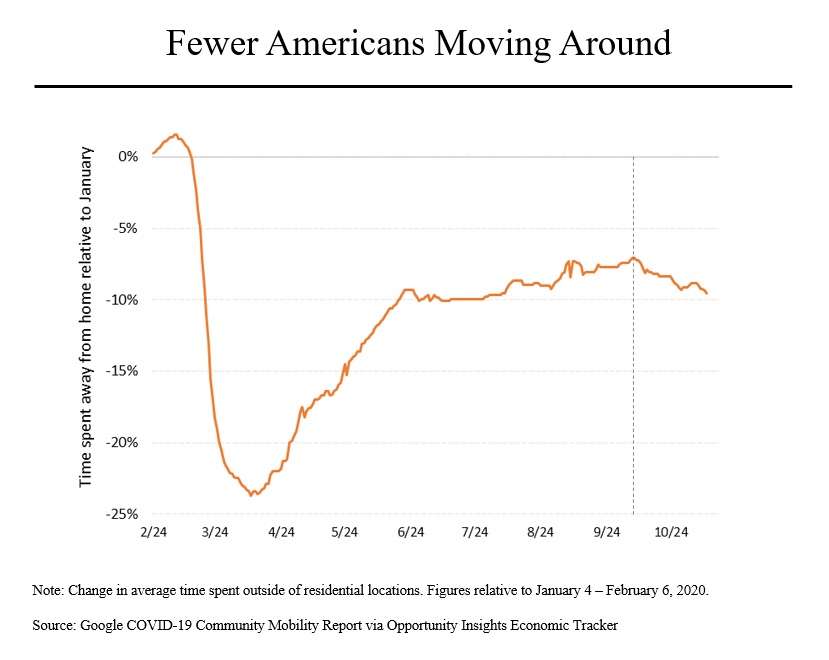
For starters, Americans are moving around less. As this chart shows, at its worst, the lockdown last spring caused Americans to reduce their time out of the home by nearly 25%. By the summer, that figure was down to around 10% and by early October, the drop off was down to just 7.1%. But since then, time spent outside the home has declined; as of last week, it had dropped by 9.5% compared to pre-virus levels.
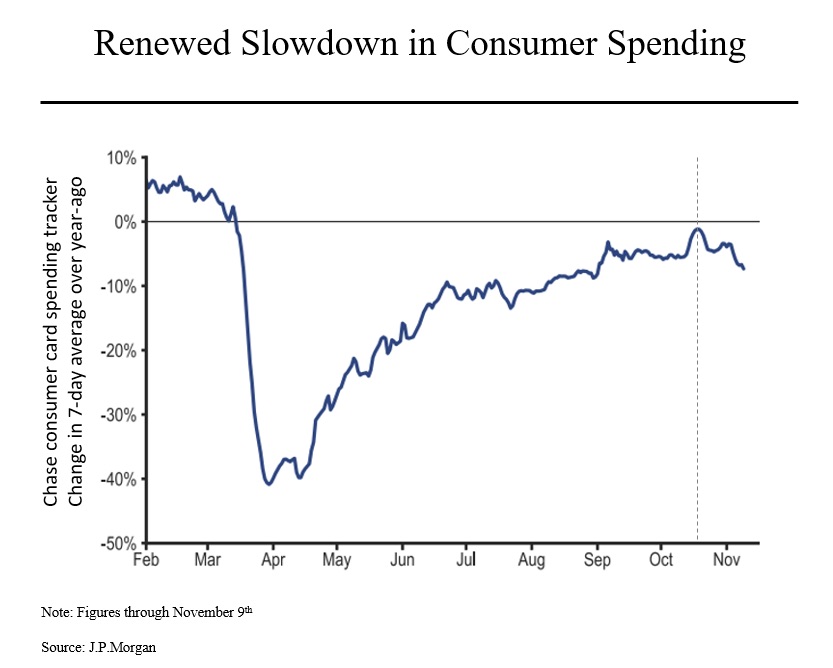
Less mobility correlates closely to less spending and indeed, the number of shoppers in retail stores peaked in mid-September. Credit card data from Chase bank shows a similar pattern; a sharp drop off in spending and then a slower climb back to nearly last year’s levels. But in just the past two weeks, the amount being spent has fallen by 2.7 percentage points, the weakest reading since early September. Other data, such as restaurant visitors tracked by OpenTable, shows a similar trend. Even online spending is showing weakness.
More granular data shows a correlation between states that have had the biggest increase in cases and states that have had the largest declines in spending. For example, consumer outlays in North Dakota, which has had one of the biggest surges in infections (on a per capita basis), are down about 7% in the past two weeks. (That said, the pullback in spending has been broad-based, with almost every state showing a decline.)
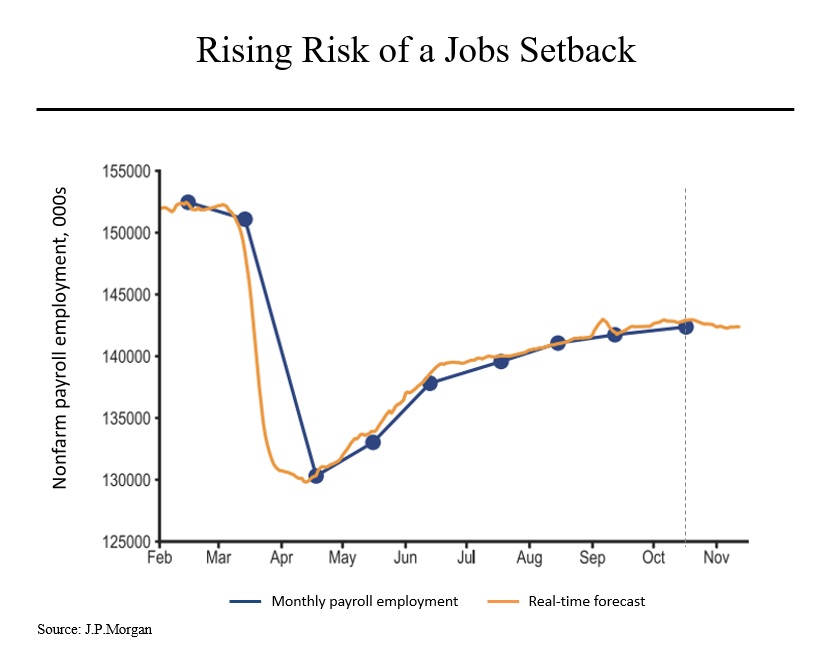
While monthly and weekly jobs data continues to show a positive – albeit slowing – trend, a measure created by JPMorgan using alternative data, suggests that hiring is weakening. This chart tracks the JPM alternative data against the monthly Department of Labor statistics; the close correlation is apparent. Since the most recent government report, for the month of October, the alternative tracker has not only stopped improving, it has deteriorated. This suggests that based on current trends, when the November jobs report is released in early December, the number of American jobs could show an actual decline.
These concerns have begun to permeate forecasts for economic growth. Earlier this month, both Goldman Sachs and JPMorgan trimmed with estimates for gross domestic product for the first quarter of next year, as a result of the surging virus cases as well as the lack of additional stimulus.