On MSNBC’s Morning Joe today, Steven Rattner presented charts explaining how the stronger-than-expected job gain in May was heavily due to Washington’s swift and massive implementation of stimulus.
As economists have digested Friday’s surprising jobs numbers, the consensus conclusion as to the biggest reason for the positive news centers around the massive and quick stimulus implemented by Washington.
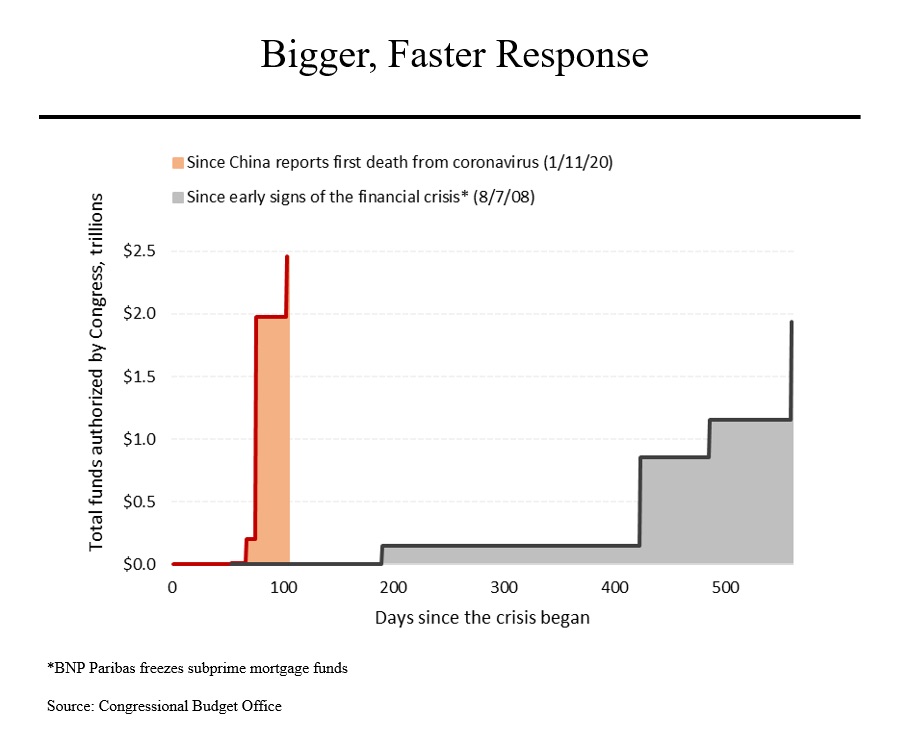
Using lessons learned from the financial crisis, lawmakers implemented rescue packages that dwarfed what was done in 2008-9 and were put in place much faster. The horizontal axis of this chart shows the number of days since the onset of each crisis; the vertical axis shows the cumulative size of each set of initiatives. In the previous downturn (shown in grey on the right side), very little was done until more than a year after the problems became evident and when the last legislation was enacted 560 days later, the total was just under $2 trillion.
This time around, Congress began acting less than two months after the virus appeared in China and to date, about $2.5 trillion of new spending and tax cuts has been approved.
In addition, the Federal Reserve has behaved in a similarly swift fashion. In 2008-9, the Fed implemented – over six years — liquidity programs that totaled $3.6 trillion. Over the past three months, the Fed has announced nearly $6 trillion of new initiative, including both the revival of programs used the last time around as well as the creation of new facilities.
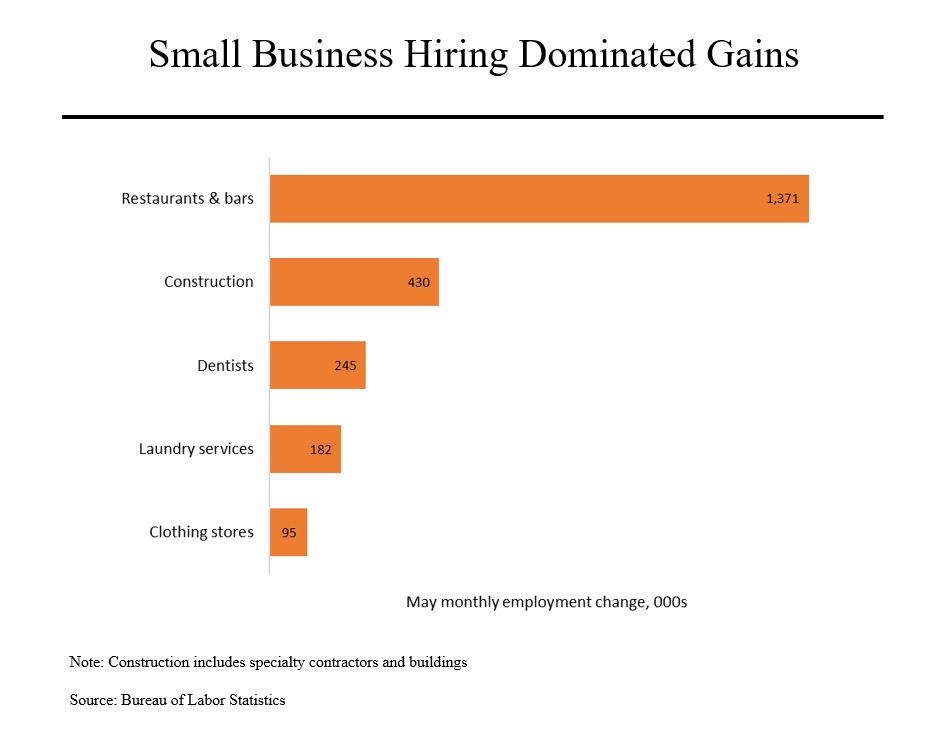
We can see in Friday’s data clear evidence for how these rescue programs have helped. About 93% of the 2.5 million job gains last month came from five categories of employers heavily dominated by the small businesses that were helped by the Payroll Protection Program. (As a reminder, the PPP provides, among other things, eight week of payroll funding for eligible businesses.) Much of this funding did not start becoming available until the latter part of April.
The list is dominated by restaurants and bars but also includes construction and even dentists. Note that these businesses don’t have to be operating – and indeed many weren’t, like most restaurants and bars. Take, as another example, dentists; it’s unlikely that many more Americans went to the dentist in May but the PPP allowed them to rehire laid off workers.
Meanwhile, we continued to lose jobs in other sectors, particularly hotels.
Analysts had previously expected unemployment to peak in June or July and to reach 20% or more. So in effect, the downturn was a bit less severe and ended a little sooner than anticipated. In addition, the “headline number” from the Bureau of Labor Statistics substantially understates the amount of pain being felt by American workers.
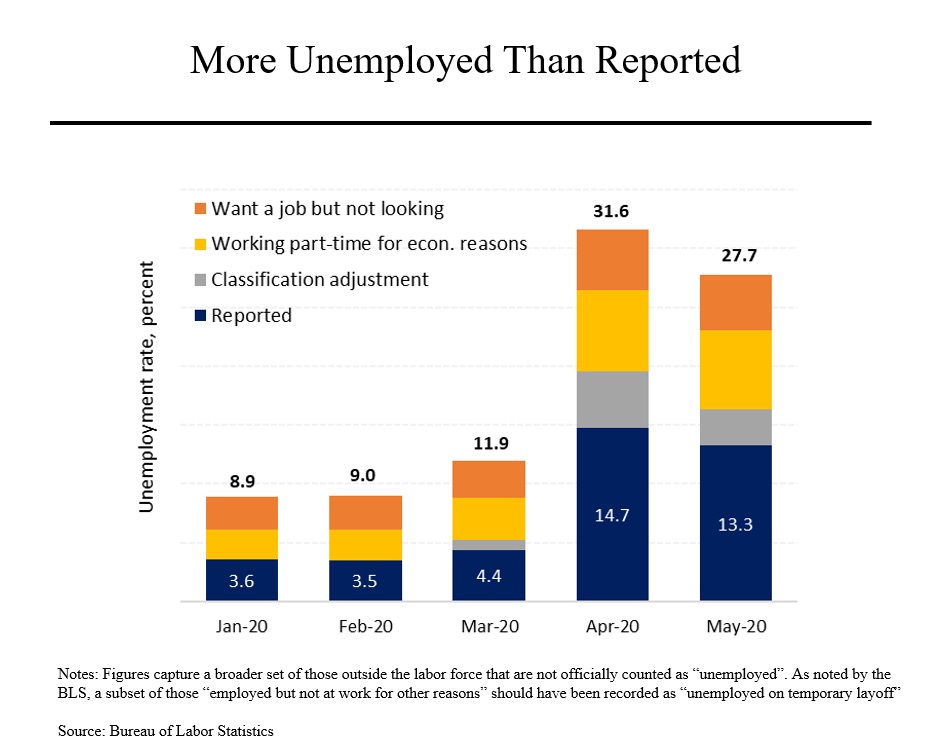
Looking at the May figures, the 13.3% unemployment rate does not include another 3.1% of Americans that were unemployed but not included due to what the BLS calls a “classification error.” In addition, as is the case every month, the BLS methodology does not include Americans who are working part-time but want to work full time (6.7%) and those who want to work but are not actively looking (4.6%).
Putting this all together, the percentage of Americans who can be said to be unemployed or underemployed was still nearly 28% in May, down modestly from 31.5% in April.
Ironically, this good news may turn out to be bad news for the economy. Republicans and Democrats have been locked in a struggle over whether another package is needed and if so, what it should contain. Seemingly better economic news is likely to stiffen Republican resolve to keep any further efforts modest. Meanwhile, the PPP only provides eight weeks of payroll and special unemployment benefits run out at the end of July.