On MSNBC’s Morning Joe today, Steven Rattner presented charts showing evidence of how the 2017 tax law has disproportionately hurt residents of “blue states” that historically have been heavy users of the state and local tax deduction.
Elections have consequences, and one of the consequences of the 2016 election was the introduction of a $10,000 cap on the deduction for state and local taxes (known as SALT). Now, even with the new law having been in effect for only one tax year, the impact of that change is becoming clear.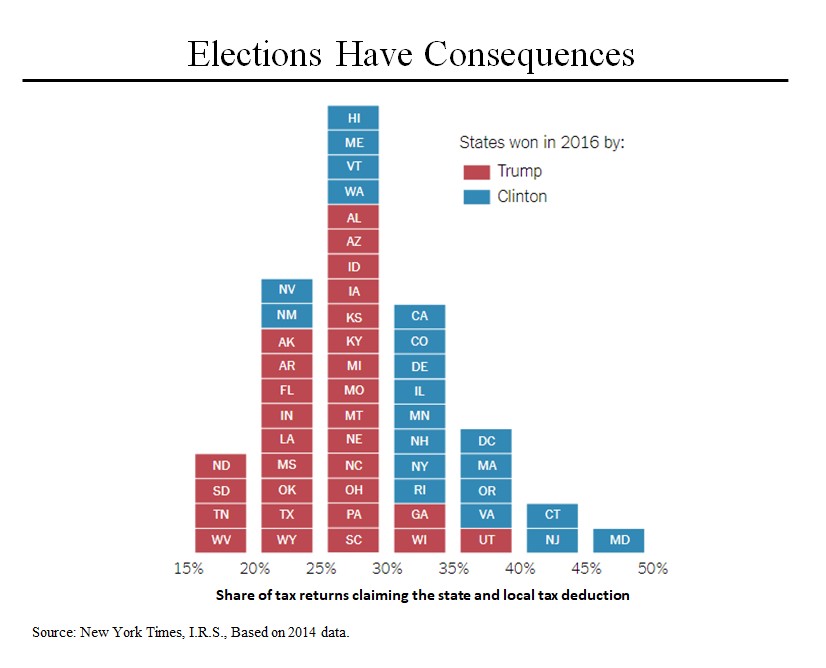
Let’s start by breaking down the states that each of Donald Trump and Hillary Clinton won according to the share of tax returns that historically claimed this deduction. Not surprisingly, an overwhelming percentage of the states that had been the heaviest users of the deduction were Clinton states while residents of the “red states” derived less benefit from it. Thus, it’s clear that this change in law has inflicted more pain on the “blue states.”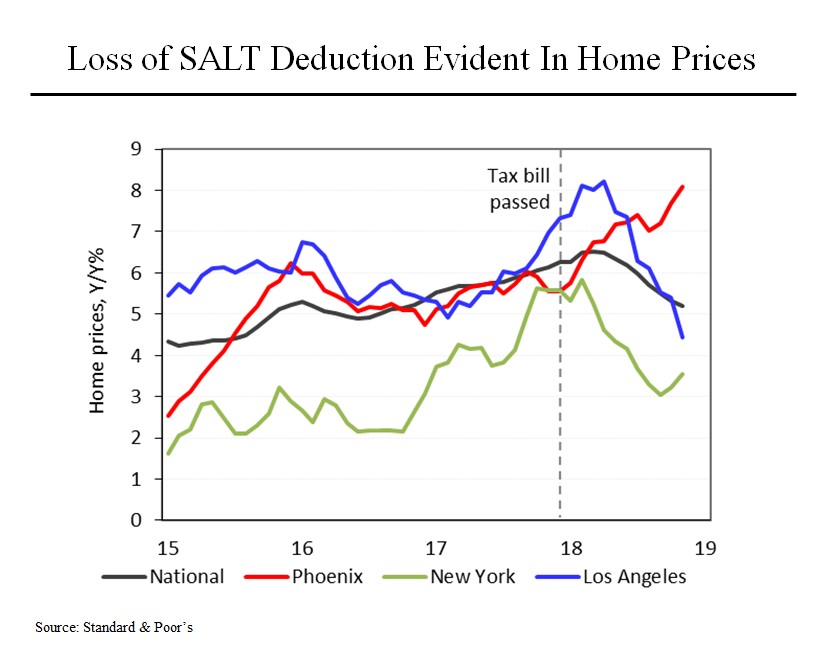
Perhaps surprisingly, the impact of that change has already begun to show up in the rate of appreciation in house prices. This chart compares how fast home prices have increased across the nation and in three representative markets: Phoenix, New York and Los Angeles. As is evident, prior to the new law, home prices were increasing at pretty similar rates in each of these markets, particularly right at the time that the new law was passed at the end of 2017.
Now look what’s happened in 2018. The rate of appreciation has actually accelerated in Phoenix, while it has dropped sharply in New York and Los Angeles. If we looked at other markets, we would see a similar effect. And anecdotal evidence supports this conclusion.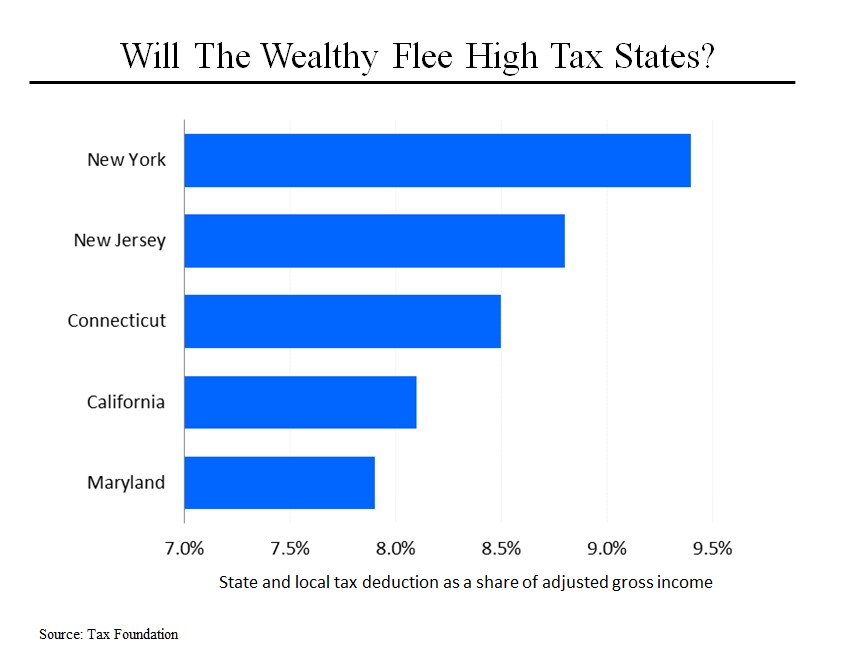
What can’t be documented yet – but which is also suggested by anecdotal evidence – is how many residents of these high tax states are actually leaving. Governor Andrew Cuomo of New York said a few days ago that the state faced a $2.3 billion shortfall for 2017 and blamed wealthy New Yorkers changing their residence for at least part of this shortfall. (The sharp decline in equity markets at the end of 2017 also clearly played a role).
Based on effective state and local tax rates, this chart shows the states at greatest risk of losing wealthy taxpayers. All of them voted for Mrs. Clinton in 2016.