On MSNBC’s Morning Joe today, Steven Rattner discussed that Republicans are more likely than not to lose control of the House due to Trump’s historically low approval rating and a surge in G.O.P. retirements.
The mid-term elections are now just 3 months away and President Trump has moved into full campaign mode to try to save his majorities in the House and Senate. While the Senate map favors the Republicans, the prospects in the House are decidedly in the Democrats’ favor.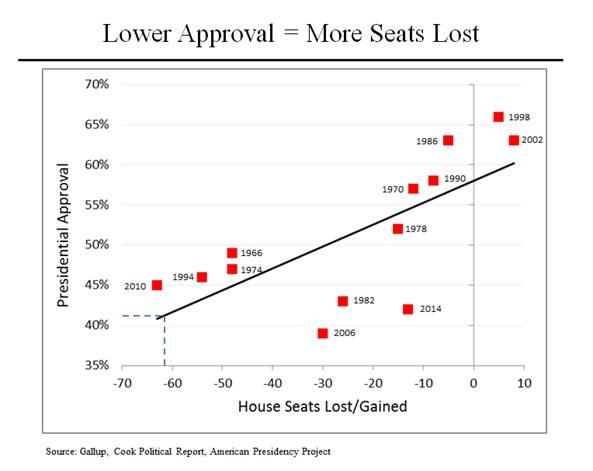
As this chart shows, there is an extremely high – 70% – correlation between a president’s approval ratings and how his team fares in the mid-term elections. Each red box on this chart represents one of the last 13 mid-term elections. Each compares that incumbent’s approval rating with the number of House seats lost (or, in two cases, gained). The black line represents a statistical analysis using these data points and the president’s approval rating to suggest the likely outcome of a mid-term election.
So, for example, if the president had a 50% approval rating, his party would still be expected to lose around 30 seats in the House. Of course, Donald Trump doesn’t have a 50% approval rating – at a 41% approval rating, history would suggest a loss of more than 60 seats, vastly greater than the 23 needed to swing control to the Democrats.
The last president to face vaguely similar circumstances was Barack Obama in 2010. His approval ratings were higher than Trump’s but amidst the Tea Party uproar, he lost more than 60. The only other president to face the mid-terms with approval ratings similar to Trump was George W. Bush in 2006 – he lost 30 seats.
The president’s party has gained seats in a mid-term election only 3 times since the Civil War. Two of those were relatively recently: Clinton in 1998 and Bush 43 in 2002. Both were exceptional circumstances: Clinton had a 66% approval rating amidst the backlash against the Lewinsky investigation and Bush had almost as high an approval rating in the post 9/11 environment.
Note that there is a much smaller correlation between economic conditions and the outcome of mid-term elections – only 24%, as analyzed using the then-current unemployment rate.
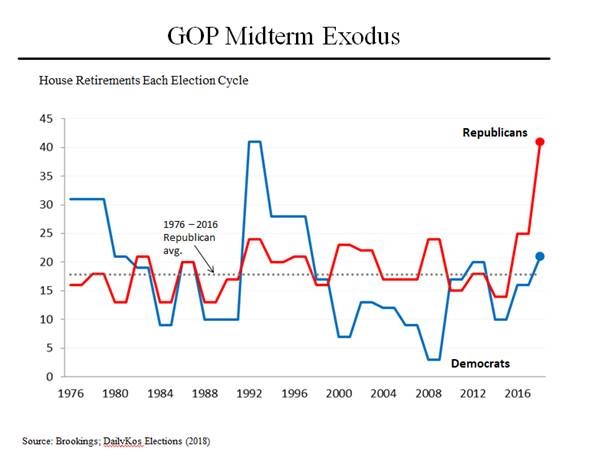
A second important factor is the number of retirements. Because the vast preponderance of incumbents is reelected (on average, 85%), a retirement, which creates an open seat, provides an atypical advantage for the challenging party. This year, there have already been 41 Republican retirements – more than double the historic average. Democrats, by contrast, are retiring at right around the historic average. When the Democrats faced a retirement problem like the Republicans, it was in the run up to the 1994 mid-term elections, an election in which the Democrats lost 53 seats.
It’s also interesting to note that only 4 Republican-held seats are without a Democratic challenger. That’s the lowest in modern history. Generally, between 10 and 40 Republican seats go unchallenged. By comparison, 37 Democratic seats lack a Republican aspirant.
Many organizations have tried to project the likely outcome of the mid-terms. That’s particularly difficult this year, in large part because of the uncertainties around turn out. The results from the special elections that have been held since Mr. Trump became president suggest that Democratic voters are more motivated, but the data is hardly conclusive.
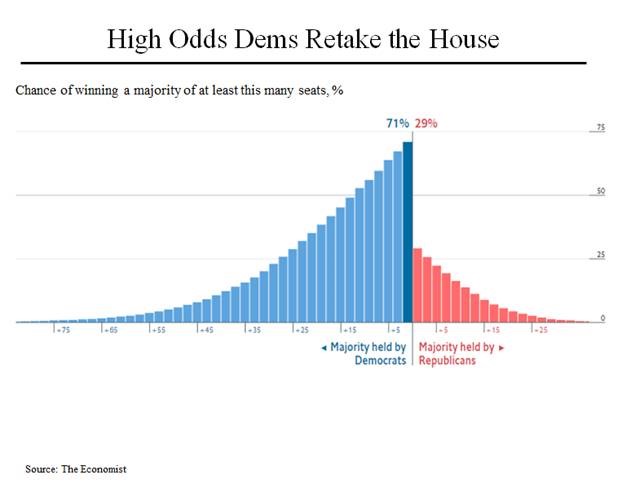
With all that said, using figures from the Economist, this chart depicts one credible effort at estimating the outcome of the November House election. By this math (which was done using 10,000 simulations), there is close to a 100% certainty that Democratic candidates will receive more votes than Republican candidates. But because of gerrymandering and other factors that favor Republicans, The Economist puts the odds of a change of control at just over 70%. And it puts a 50% probability on Democrats flipping 37 seats, which would give them a majority of 14 seats.
Lastly, there is the question of how big a margin in the overall vote the Democrats need to achieve to overcome the effects of gerrymandering and other factors that favor the Republicans. The Economist calculates this to be 3.5%; other organizations have produced higher numbers.