On MSBNC’s Morning Joe today, in light of yesterday’s agreement to suspend the trade war, Steven Rattner put US-EU trade into perspective.
President Trump and Jean-Claude Juncker, the president of the European Union, announced an “agreement” late Wednesday afternoon to suspend the brewing trade war between the world’s largest developed countries. But even if this understanding is consummated, will it really make much of an economic difference to the United States?
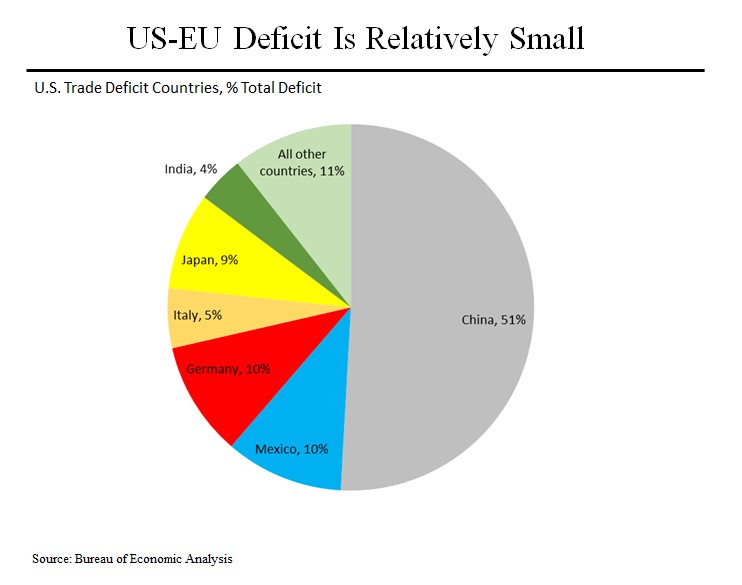
For starters, our trade deficit with members of the European Union is relatively small. Within that total, Germany represents roughly two-thirds of the total while Italy – yes, Italy – represents the other third. We have smaller surpluses and deficits with other European countries that essentially cancel each other out: we have deficits with France and Ireland while we have surpluses with the United Kingdom and the Netherlands.
In dollar terms, our total deficit totals about $550 billion (not the $817 billion figure that Trump keeps citing, which is just our trade in goods) and Europe accounts for just over $100 billion of it. And note that that deficit is in the context of total trade between the two entities, which is in excess of $1.1 trillion.
Not surprisingly, China accounts for fully half of our trade gap.
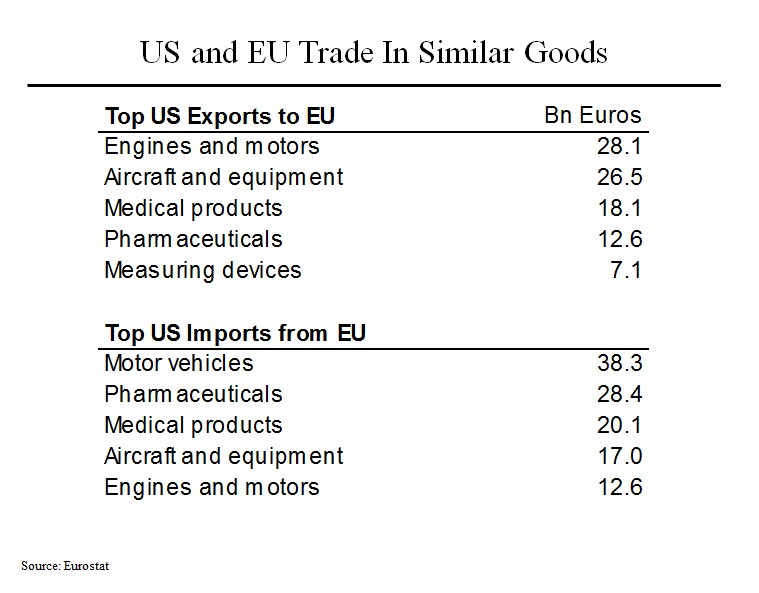
When you look at what Europe and the United States send to each other, what’s interesting is how much overlap there is. It’s not as if we just send them soybeans and they send us German cars. (In fact, we send them relatively few soybeans.) Instead, for example, we sell them Boeing planes; they sell us Airbus planes. We sell them pharmaceuticals; they sell us pharmaceuticals. We sell them medical products; they sell us medical products.
Why does this trade in seemingly identical products occur? Because each party believes they are better off buying from a more distant supplier – maybe it’s the particular item, maybe it’s the price. It’s the epitome of what Adam Smith and David Ricardo were thinking of when they developed the early concepts of comparative advantage and more trade among nations.
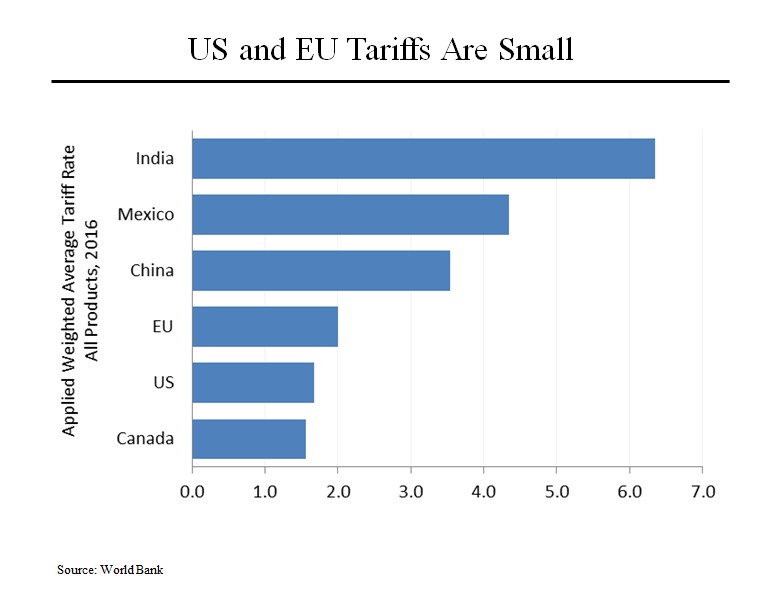
Listening to the rhetoric, you would be excused for thinking that there must be massive tariff barriers between the U.S. and Europe. Hardly. As this chart shows, the average tariffs imposed by the U.S. and the E.U. are nearly identical, just a few tenths of a percent difference. (1.96% for the EU vs. 1.67% for the US.)
This chart illustrates another important point: when global trading rules were established, it was agreed that developing countries would get more favorable treatment than developed countries. Perhaps it’s time to change some of those rules but, for the moment, that is the agreement that all members of the World Trade Organization agreed to.
