President Trump promised a “massive” tax cut proposal and on that score at least, he delivered (although it was not the largest in history, as he had promised.)
Note: for the related Morning Joe video, please click here.
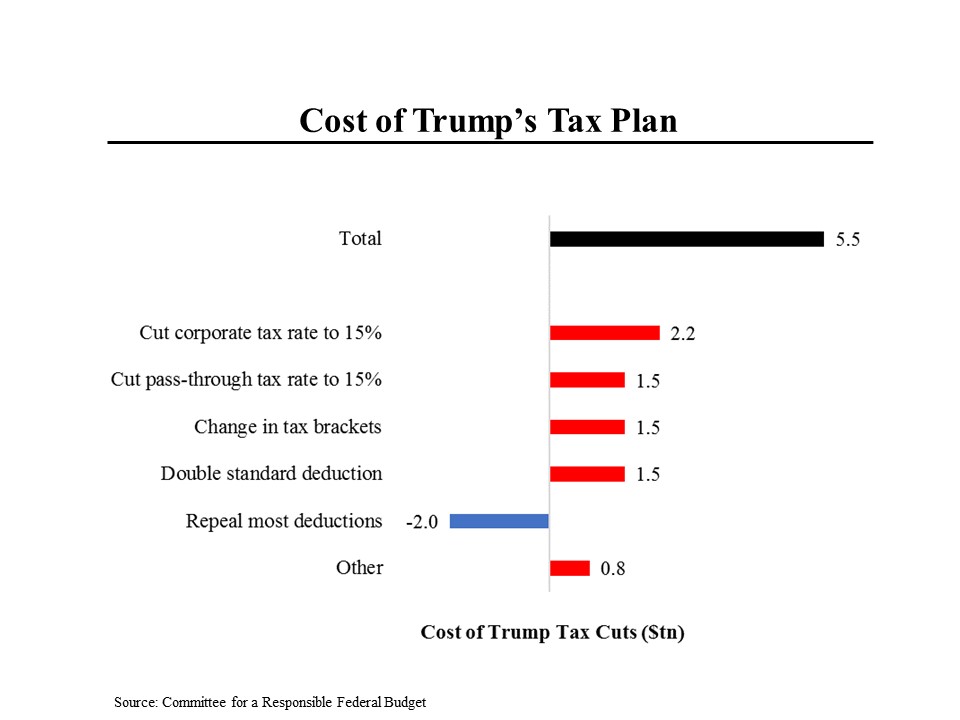
The plan that was unveiled Wednesday – still missing many details – included $7.5 trillion of tax reductions and $2 trillion of tax increases, for a net cut of $5.5 trillion. Particularly noteworthy is the fact that fully two-thirds of the cuts would go to business by reducing its tax rate from 35% to 15%. Notably, the President intends to afford the 15% rate to “pass throughs” (LLC’s through which many individuals operate their businesses). While some of these pass throughs are the small businesses that the President’s team emphasized in its announcement, many high income Americans – including hedge fund managers, doctors and the like – operate as pass throughs.
For other Americans, the President has offered some sensible ideas, albeit in much smaller amounts. The current 7 tax brackets would be reduced to 3 (income levels have not yet been specified.) The standard deduction would be doubled, allowing many more Americans to avoid the cumbersome task of itemizing their deductions. And most other deductions would be eliminated (including, importantly, the deduction for state and local taxes.)
In addition to lowering tax rates for wealthy Americans, the President wants to do more for the elite: eliminate a 3.8% tax on investment income, abolish the alternative minimum tax and eliminate the estate tax.
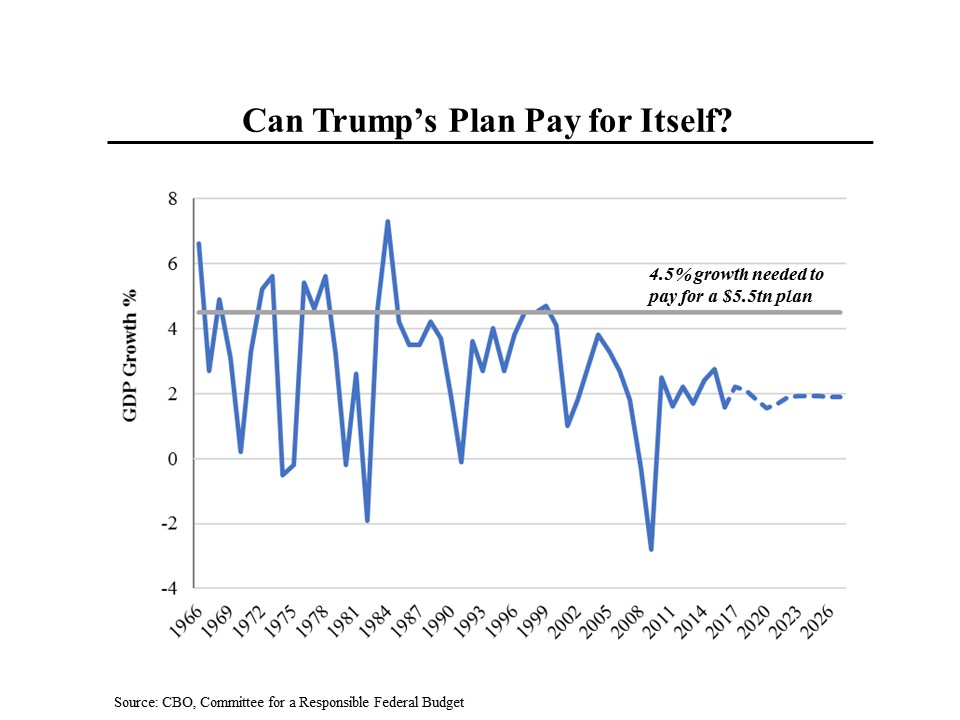
Apart from the question of fairness, the other major issue around the tax plan is whether it can pay for itself. For months, Treasury Secretary Stephen Mnuchin has insisted that it would. But that would require economic growth of 4.5% per year, which even Mr. Mnuchin has not suggested is possible. (He has suggested that 3% would be an ambitious target.) As this chart shows, we are currently bumping along at about 2% growth; apart from one year in the late 1990s, the last time we had growth above 4.5% was more than 3 decades ago. Since then, our labor force has been growing more slowly as our population ages and productivity has been weak. Those are the two key impediments to achieving faster growth.
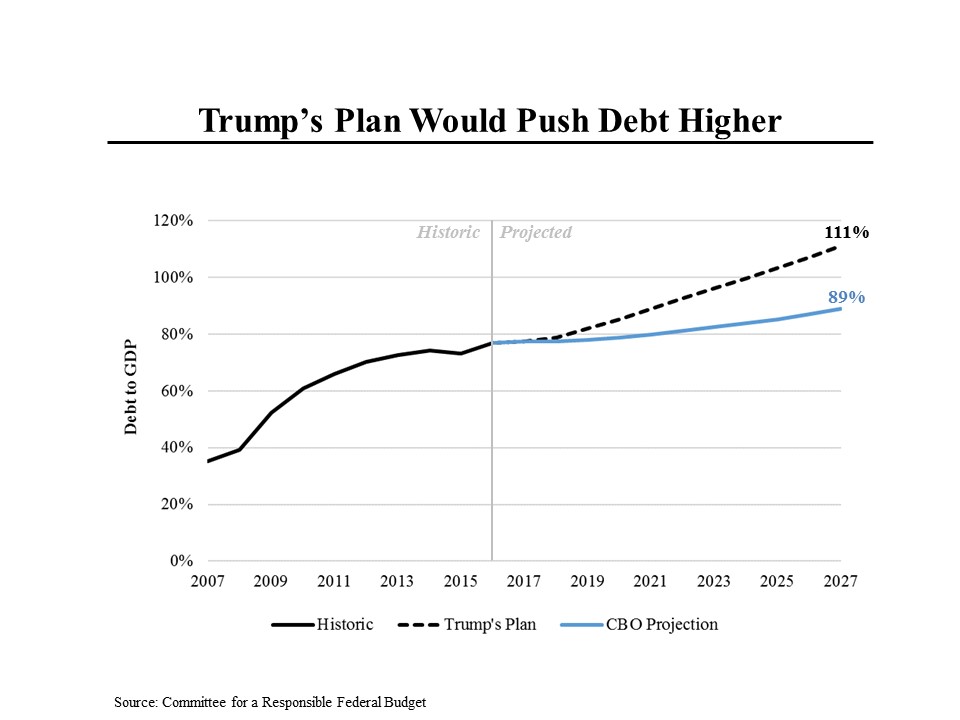
Under more conventional growth assumptions, the Trump tax plan doesn’t come close to paying for itself. The Congressional Budget Office projects economic growth over the next 10 years will hover in the current range of just under 2%. Using that assumption, the Committee for a Responsible Federal Budget projected yesterday that the ratio of debt to GDP – already at an historic high of just under 80% would rise sharply and reach 111% by 2027, above every previous high except for a short period after World War II.


