Originally published in the New York Times
The weak economy, widening income inequality, gridlock in Congress and a presidential election: Those were perhaps the dominant economic and political themes of 2012. To supplement the torrent of rhetoric, I offer charts to help provide facts and context for the debate around these important issues. Below are nine of my favorites from the past year.

In 2012, the slow recovery dominated both the economic news and the worries of most Americans, but the underlying components of the weak job market were not always fully dissected. In fact, job growth was so paltry in large part because it was so unbalanced. Since the recession ended in June 2009, three key sectors – government, construction and information – that together account for 22 percent of all employment lost more than 1 million jobs. Equally significantly, two of them, government and construction, generally add a disproportionately large share of jobs during a recovery. With government contracting and construction stalled, that did not occur.

The economic boom that peaked in 2007 represented the first time that median real (that is, inflation-adjusted) incomes did not recover to their previous peak before declining into the next recession. More ominously, family incomes have yet to recover, even though the recession ended three and a half years ago. That has brought the total decline in real incomes to nearly 9 percent since 2000. So where has the economic growth from the recovery gone? Much of it has gone to corporate profits, as companies took advantage of the high unemployment rate and the ability to shift production globally to hold down wages in the United States.
The rise in income inequality has exacerbated the decline in median incomes. In 2010, a stunning 93 percent of all income gains went to the top 1 percent of Americans. Also astonishing: just 15,000 households received 37 percent of all of those income gains. In no other period in recent American history have economic gains been concentrated so disproportionately in an elite sliver. (The red bars indicate recessions.)

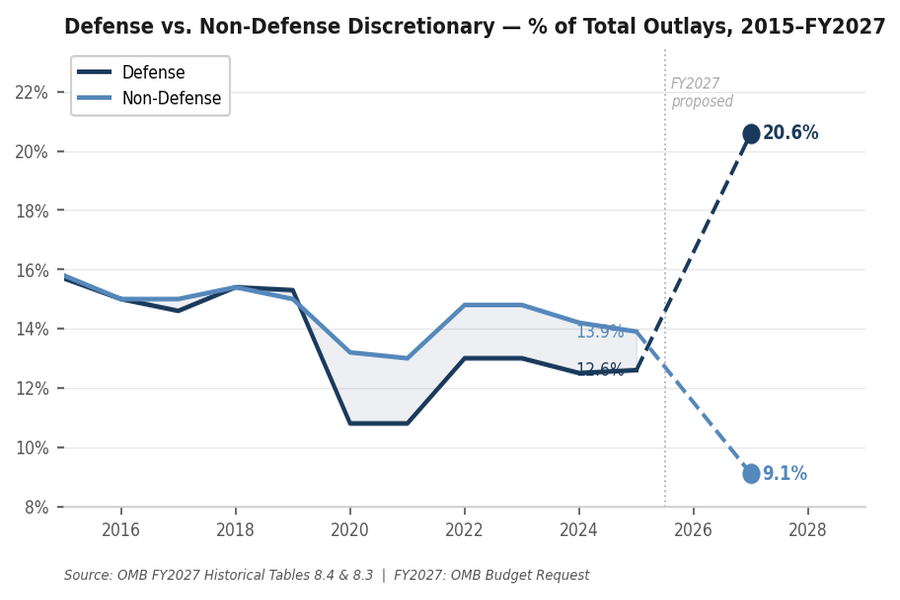
The explosion of the federal budget deficit since the turn of the century stems from multiple causes, including huge tax cuts in 2001 and 2003 and rapid spending growth in many areas like defense, and later, the stimulus to combat the recession. But no budget-busting factor looms larger than the soaring cost of government-financed health care, particularly Medicare and Medicaid. In addition to driving current and projected deficits, the rise in spending has squeezed the resources available for other domestic programs. Often dismissed as wasteful government spending, these “discretionary” programs include important areas of investment, such as infrastructure, research and development and education. In reducing such investments, we are eating our seed corn.

Large deficits have driven a key ratio – government debt to gross domestic product – to 72.8 percent, from 36.2 percent in 2007. But without new policies, that’s just the beginning. Under realistic assumptions, the debt-to-G.D.P. ratio will rise to more than 80 percent over the next decade. The recommendations of the Simpson-Bowles Commission, if adopted by President Obama and Congress, would have brought this ratio down to 65 percent by 2022. But that plan never was adopted. Even if one of the proposals being debated by the White House and Congressional Republicans, very similar in the impact on the deficit, were put in place, it would only manage to drive down this ratio to 72 percent and stabilize it there – a minimally acceptable goal.

The debate over budget-cutting has touched off fierce emotions on all sides, sometimes at the expense of facts. Take, for example, the proposal to change the cost-of-living adjustment used to calculate Social Security benefits. Rarely discussed in that context is the fact that the current adjustment formula has delivered benefit increases to Social Security recipients that are larger than the wage increases of average Americans – a difference of more than $2,500 over the past 12 years.

That Congress has ceased to function effectively has become an article of faith for most Americans. But the extent of the gridlock on Capitol Hill may not be fully appreciated. Over its two-year life span, the 112th Congress that just adjourned passed just 200 laws, 31 percent of the average of the 32 Congresses preceding it. Even the bills that were passed were mostly housekeeping measures, like laws to name post offices or extend existing laws. Now, some may say, “That’s great. I don’t want Congress to do anything anyway.” I have a different view. I believe that our country has many problems and that our federal lawmakers are paid to help address them.

Another article of faith is that Congress has become far more polarized. That general perception is well supported by a number of academic studies. For example, one researcher, Keith T. Poole, assigned a score to each member of Congress based on his or her voting record. He then calculated an average for Democrats’ and Republicans’ scores and used the difference to create an index. His conclusion was that the House has become more polarized than at any time since at least 1879, and the Senate nearly so.

Nate Silver was not the only statistically based political prognosticator to cover himself with glory during the recent presidential election. The online betting service Intrade did nearly as well. Throughout the ups and downs of a hard-fought campaign season, it remained solidly confident that President Obama would be re-elected. (The October surge in the probability of an Obama victory probably resulted from Mitt Romney’s notorious “47 percent” remark; the subsequent decline for Mr. Obama followed his poor performance in the first debate.) Intrade also predicted correctly the winner of 49 states and 31 of 33 Senate races. Mr. Silver, who writes for The New York Times, relies on statistical analysis of polling data; Intrade is a prediction market, and its electoral forecast is grounded in the widely accepted belief that the views of thousands as to who they think will win (as opposed to whom they support) provides more accurate forecasts than polls do.