Originally published in The New York Times
By the end of 2015, the economy — still leaving too many Americans behind — has regrettably almost disappeared from the news, overshadowed by the twin evils of Donald J. Trump and the Islamic State. Meanwhile, Congress continued to burnish its record of doing little that was constructive, and progress on a long list of serious policy challenges seemed stalled, at least until after the next presidential election. Here, for better or worse, is the state of the union in 10 charts.

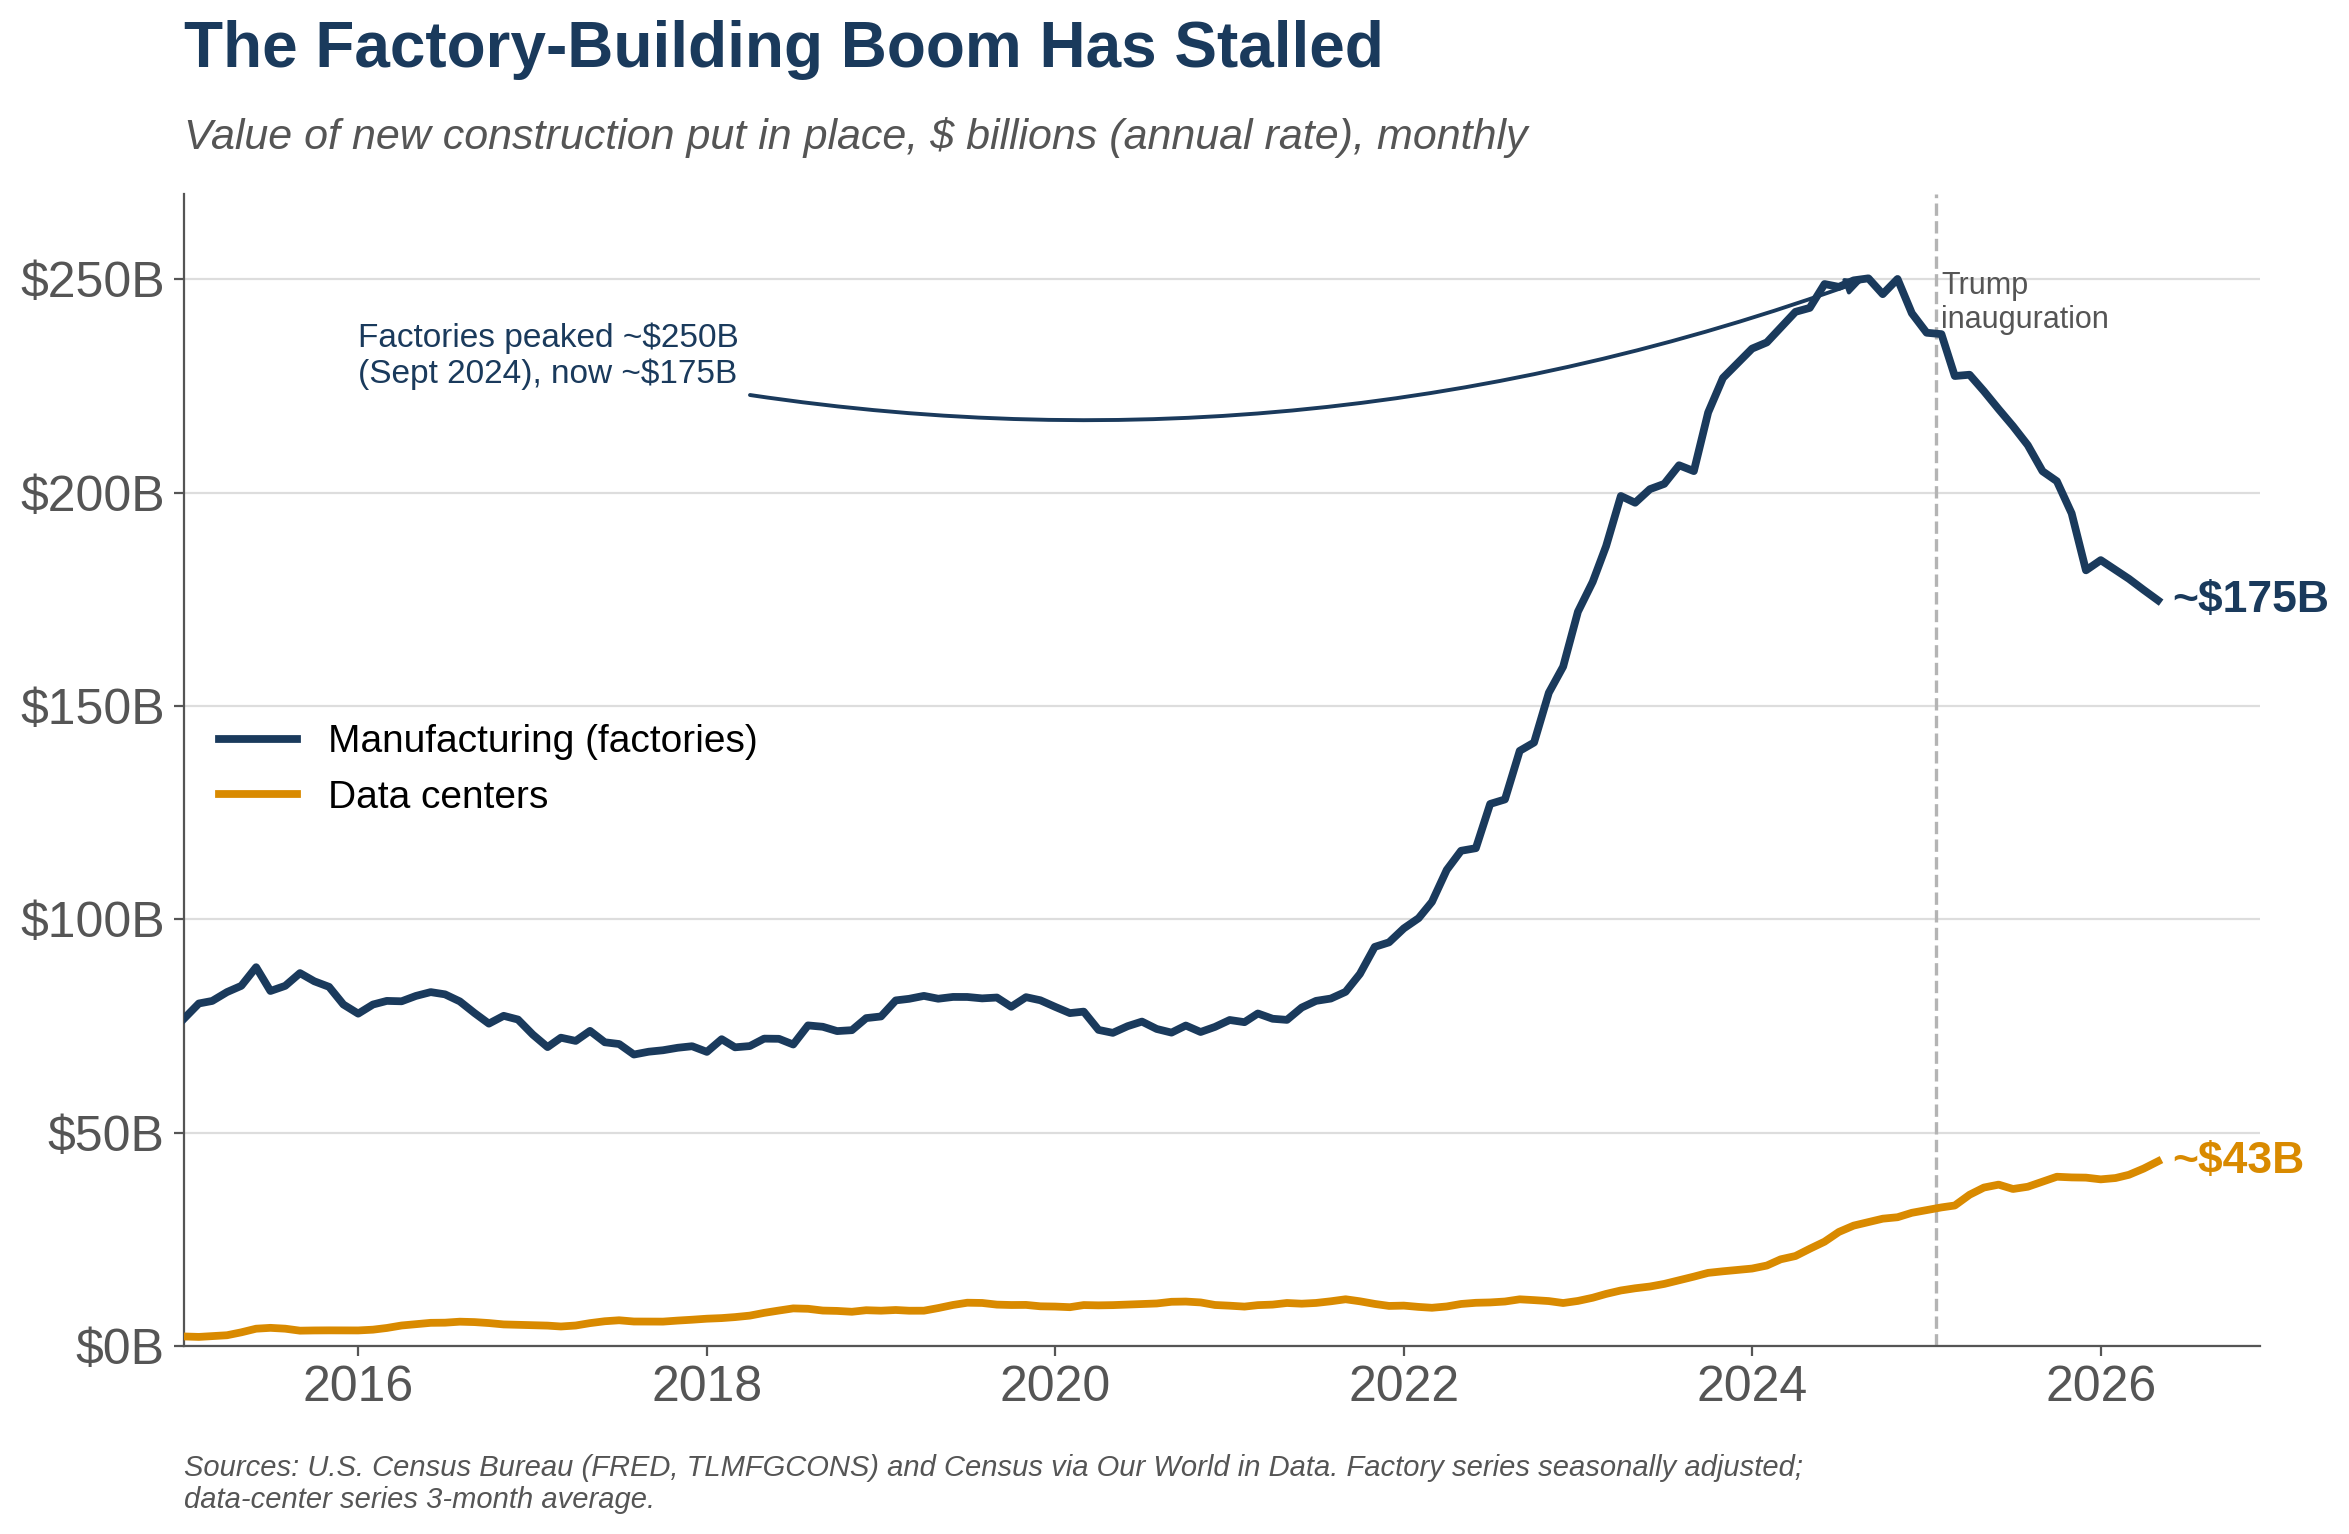
Over the past year, the brightest spot in our economy was the Great American Job Machine, which is projected to churn out 2.5 million new jobs in 2015, the second highest total since the financial crisis. As a result, the unemployment rate fell to 5 percent in November from 5.7 percent at the start of the year. Most of the job growth occurred in services, categories that include education, health, leisure, retailing and even finance. Meanwhile, global competition and a strong dollar held growth in manufacturing employment to a mere 17,000 jobs. So much for the renaissance of the American factory.
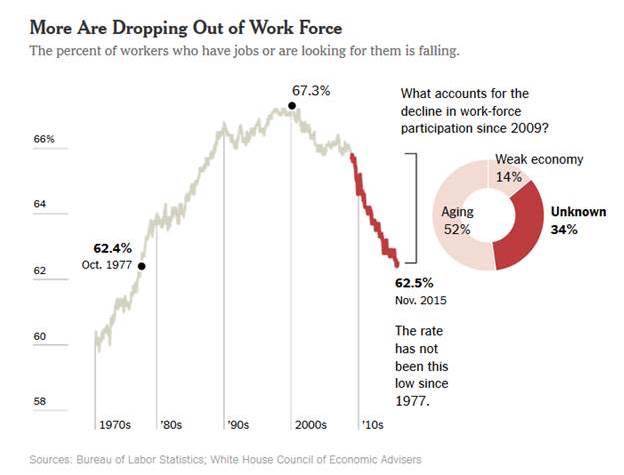
Other job-related news was less rosy. Perplexingly, the percentage of Americans who either had jobs or were looking for one (known in the parlance as the “labor force participation rate”) continued its steady drop, descending to levels not seen since the late 1970s. A big portion of this decline can be traced to an aging society, and a smaller slice to the economic downturn. But, according to the Council of Economic Advisers, the cause of some of the shrinkage is still unexplained. What we do know is that among so-called prime age workers between the ages of 25 and 54, the United States in 2014 had a lower percentage of men in the labor force than France and many other countries and about the same percentage of women working or looking for work as Japan, a country hardly thought of as a bastion of female employment opportunity. Among other consequences, the contracting labor force understates our unemployment rate.
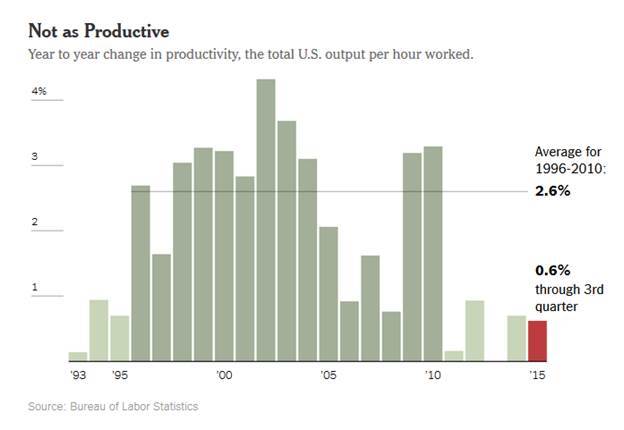
Instead of worrying about the impact of robots on employment, we should be fretting about the opposite trend: the lack of productivity growth, a key measure of worker efficiency. Without rising output per hour worked, wage increases become even harder to achieve over time, and without higher wages, economic growth will stall. After averaging 2.6 percent between 1996 and 2010 (in part because of the wave of technological innovation), productivity rose at an annual rate of only 0.5 percent between 2011 and the third quarter of 2015. Some economists argue that productivity is doing better than the numbers suggest because the methodology doesn’t take proper account of improvements in quality — like iPhones’ taking the place of the pioneering Motorola brick-size phones. But I’m skeptical of this view because our indexes have never fully reflected innovation, like the development of the automobile, for example.
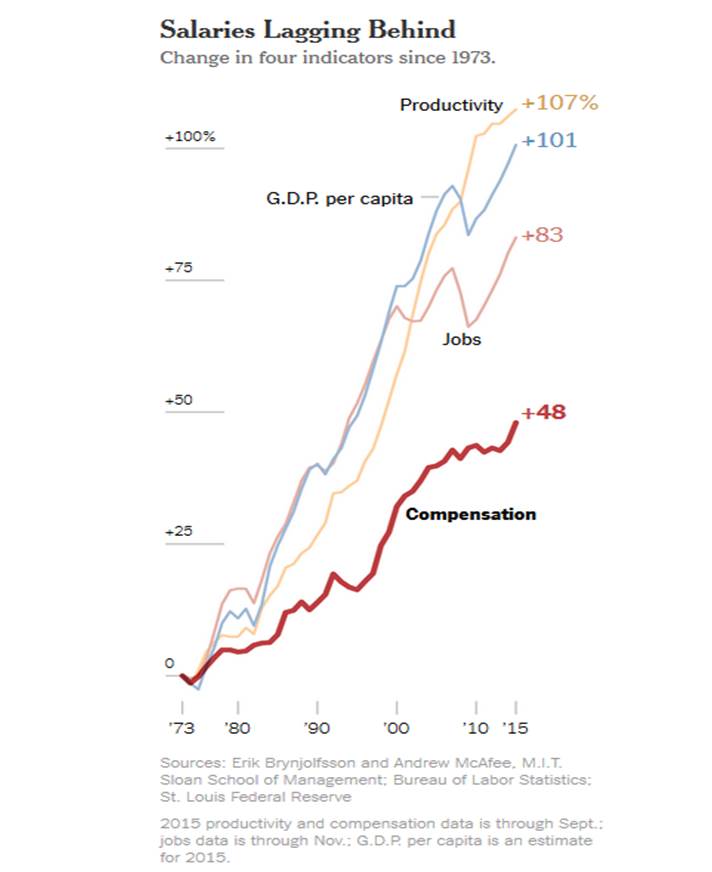
Even more worrisome is that for nearly 40 years, workers have not been seeing their pay raises (adjusted for inflation) match either their productivity increases or the rate of economic growth. That change from past trends occurred for a number of reasons, including declining unionization, the relentless pressure on companies to cut costs, and globalization. Companies can now source their labor from many developing nations whose workers are increasingly well trained. One potential flicker of hope: Toward the end of 2015, real wages finally showed tantalizing signs of increasing.
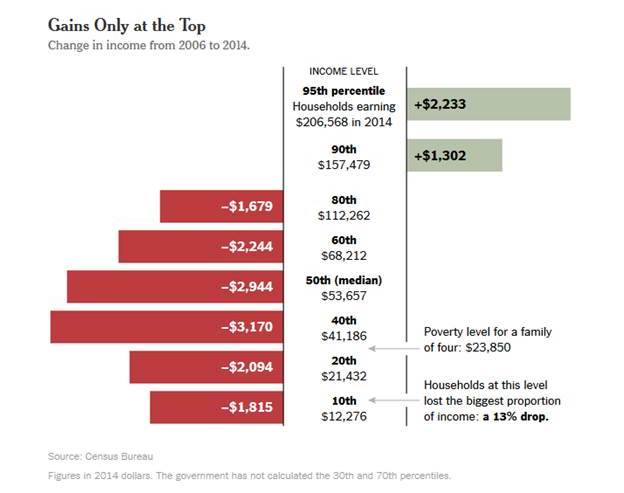
The overwhelming evidence is that the recovery has not been good for most Americans. Between 2006 and 2014, the only income groups to see their incomes rise at all after adjusting for inflation were those at the 90th and 95th percentiles. Still more dispiriting was that earnings dropped by a larger percentage for every decile one step further down the income scale. So while the wage drop was largest in dollars for the middle class, it was largest in percentage terms for those at the very bottom — the Americans who can least afford a pay cut. The inevitable consequence: Income inequality increased. Stagnant wages and rising inequality have contributed mightily to our polarized politics.

By age group, millennials — Americans now between 18 and 34 — were the indisputable losers. While graduating from college in unprecedented numbers, they are earning between 5 and 9 percent less (after adjusting for inflation) than what their elders were receiving at similar points in their careers. No other age group saw a similar decline. The reason? To a considerable degree, the recession. Starting behind often means never catching up. And not surprisingly, millennials who didn’t attend college did even worse than those who did even though, of course, many recent graduates lie underneath a mountain of debt.

For the first time since July 2006, the Federal Reserve raised interest rates. The much-debated, much-anticipated Dec. 16 decision signaled that the Fed believed that the economy was back to a point where wage growth and then inflation could occur. Not all economists agree. Incomes are barely increasing in real terms, and inflation is well below the Fed’s own target of 2 percent. The chart above shows that the Fed, which issues estimates of future interest rates, has been consistently lowering its rate forecasts while financial markets have been predicting lower rates for longer — and have been right. For consumers, the implications of this debate are consequential: Will the Fed prove correct that our economy is on a sustainable growth path, or will the market’s pessimism turn out to be the more accurate forecast? I worry that the market’s winning prediction record will continue.

While Hillary Clinton appears to be cruising to the Democratic presidential nomination, the sprawling Republican field has felt like a celebrity boxing match in which Donald J. Trump has taken on all comers. But although Trump leads in nearly every national opinion poll, the prediction markets (in which real people bet real money) have been mostly skeptical of a Trump nomination. Throughout most of the spring and summer, Jeb Bush led the pack. More recently, his lackluster campaign caused him to falter in the betting while the star of Senator Marco Rubio has risen sharply. Before despairing about Mr. Trump’s winning his party’s nomination, let’s remember that the prediction markets have a better record of forecasting election outcomes than polls and pundits.

Terrorism is on all of our minds for good reason. Deaths from terrorism worldwide have climbed to 32,685 in 2014 (and an even higher figure is expected for 2015) from 7,344 as recently as 2011. Perhaps not as widely appreciated is that terrorism is still afflicting largely the people of the Middle East and Africa. Only a small share of these deaths — less than 3 percent over the past 15 years — occurred in Western countries. Exclude the Sept. 11 attacks and that figure drops to 0.5 percent. Terrorism also drives refugee problems; 10 of the 11 countries that had more than 500 deaths from terrorism in 2014 had the highest levels of refugees and internally displaced people. And terrorism is thriving in Nigeria — as many people were killed by terrorists there in 2014 as in Afghanistan and Pakistan combined.

The evidence is overwhelming: More guns mean more deaths. In the United States, which has more guns in the hands of civilians than does any other developed country, gun-related deaths per 100,000 inhabitants vastly exceed the level in those countries. Meanwhile, countries such as Britain and Japan have small numbers of guns in private hands and very few gun-related deaths. Between 2001 and 2013, domestic gun violence killed more people in the United States than AIDS, illegal drug overdoses, wars and terrorism combined.