On MSNBC’s Morning Joe today, Steven Rattner discussed that while Republicans maintain several mid-term election advantages, Trump’s historically low approval rating together with historically high G.O.P. retirements has opened the door for Democrats to reclaim the House.
This past weekend’s round of opinion polls showed Donald Trump’s approval rate still stuck at 40% or even a bit less. That’s bad news for Republicans in the mid-term elections.
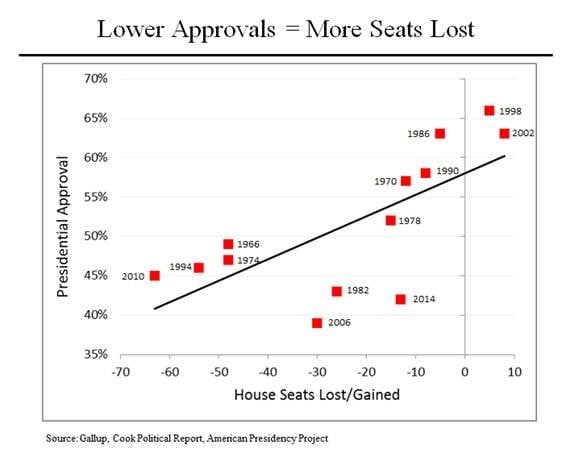
As this chart shows, there is an extremely high – 70% – correlation between a president’s approval ratings and how his team fares in the mid-term elections. Each red box on this chart represents one of the last 13 mid-term elections. Each compares that incumbent’s approval rating with the number of House seats lost (or, in two cases, gained.) The black line represents a statistical analysis using these data points and the president’s approval rating to suggest the likely outcome of a mid-term election.
So, for example, if the president had a 50% approval rating, his party would still be expected to lose around 30 seats in the House. Of course, Donald Trump doesn’t have a 50% approval rating – at a 40% approval rating, history would suggest a loss of more than 60 seats, vastly greater than the 24 needed to swing control to the Democrats.
The last president to face vaguely similar circumstances was Barack Obama in 2010. His approval ratings were higher than Trump’s but amidst the Tea Party uproar, he lost more than 60. The only other president to face the mid-terms with approval ratings similar to Trump was George W. Bush in 2006 – he lost 30 seats.
There have been two presidents who gained seats in a mid-term election: Clinton in 1998 and Bush 43 in 2002. Both were exceptional circumstances: Clinton had a 66% approval rating amidst the backlash against the Lewinsky investigation and Bush had almost as high an approval rating in the post 9/11 environment.
Note that there is a much smaller correlation between economic conditions and the outcome of mid-term elections – only 24%, as analyzed using the then-current unemployment rate.
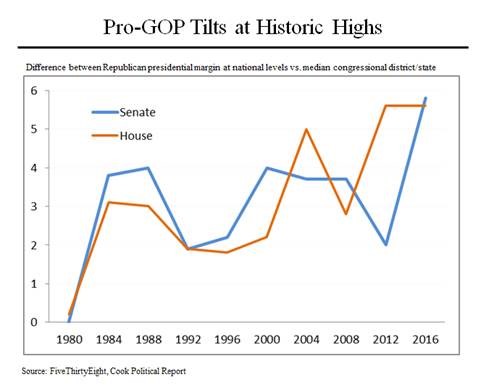
Each election, of course, is different and at least two other factors should be considered in predicting the outcome of this November’s. First, for different reasons, the Republicans have an increasing edge in both the House and the Senate. Both advantages are currently around 6%. In the House, the principal cause, of course, is gerrymandering. Perhaps court decisions like the one in Pennsylvania will redress this but that’s unlikely to make a meaningful difference this November. As to the Senate, the reason relates to the fact that there are two Senators per state, regardless of size. As increasing numbers of Democratic voters are concentrated in big blue states like California, it tilts the playing field even further in the direction of smaller red states, who also have two Senators.
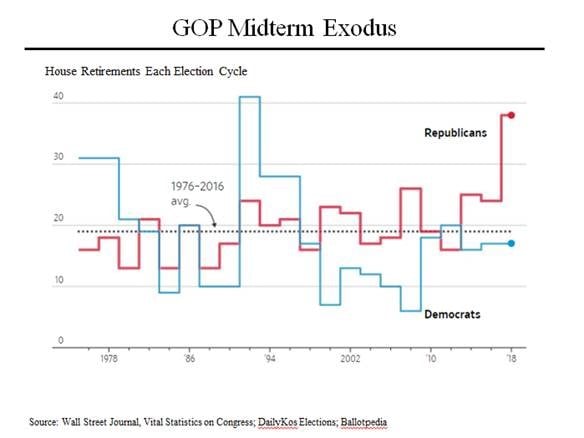
Lastly, retirements also must be factored in. Because the vast preponderance of incumbents is reelected, a retirement, which creates an open seat, provides an atypical advantage for the challenging party. This year, there have already been nearly 40 Republican retirements, double the historic average. Democrats, by contrast, are retiring at slightly less than the historic average. When the Democrats faced a retirement problem like the Republicans, it was in the run up to the 1994 mid-term elections, an election in which the Democrats lost 53 seats.


