The enormous magnitude of Donald Trump’s victory suggests that his win stemmed from a plethora of factors. But according to nearly every poll, the economy was at the top of voters’ concerns about the Biden-Harris administration.

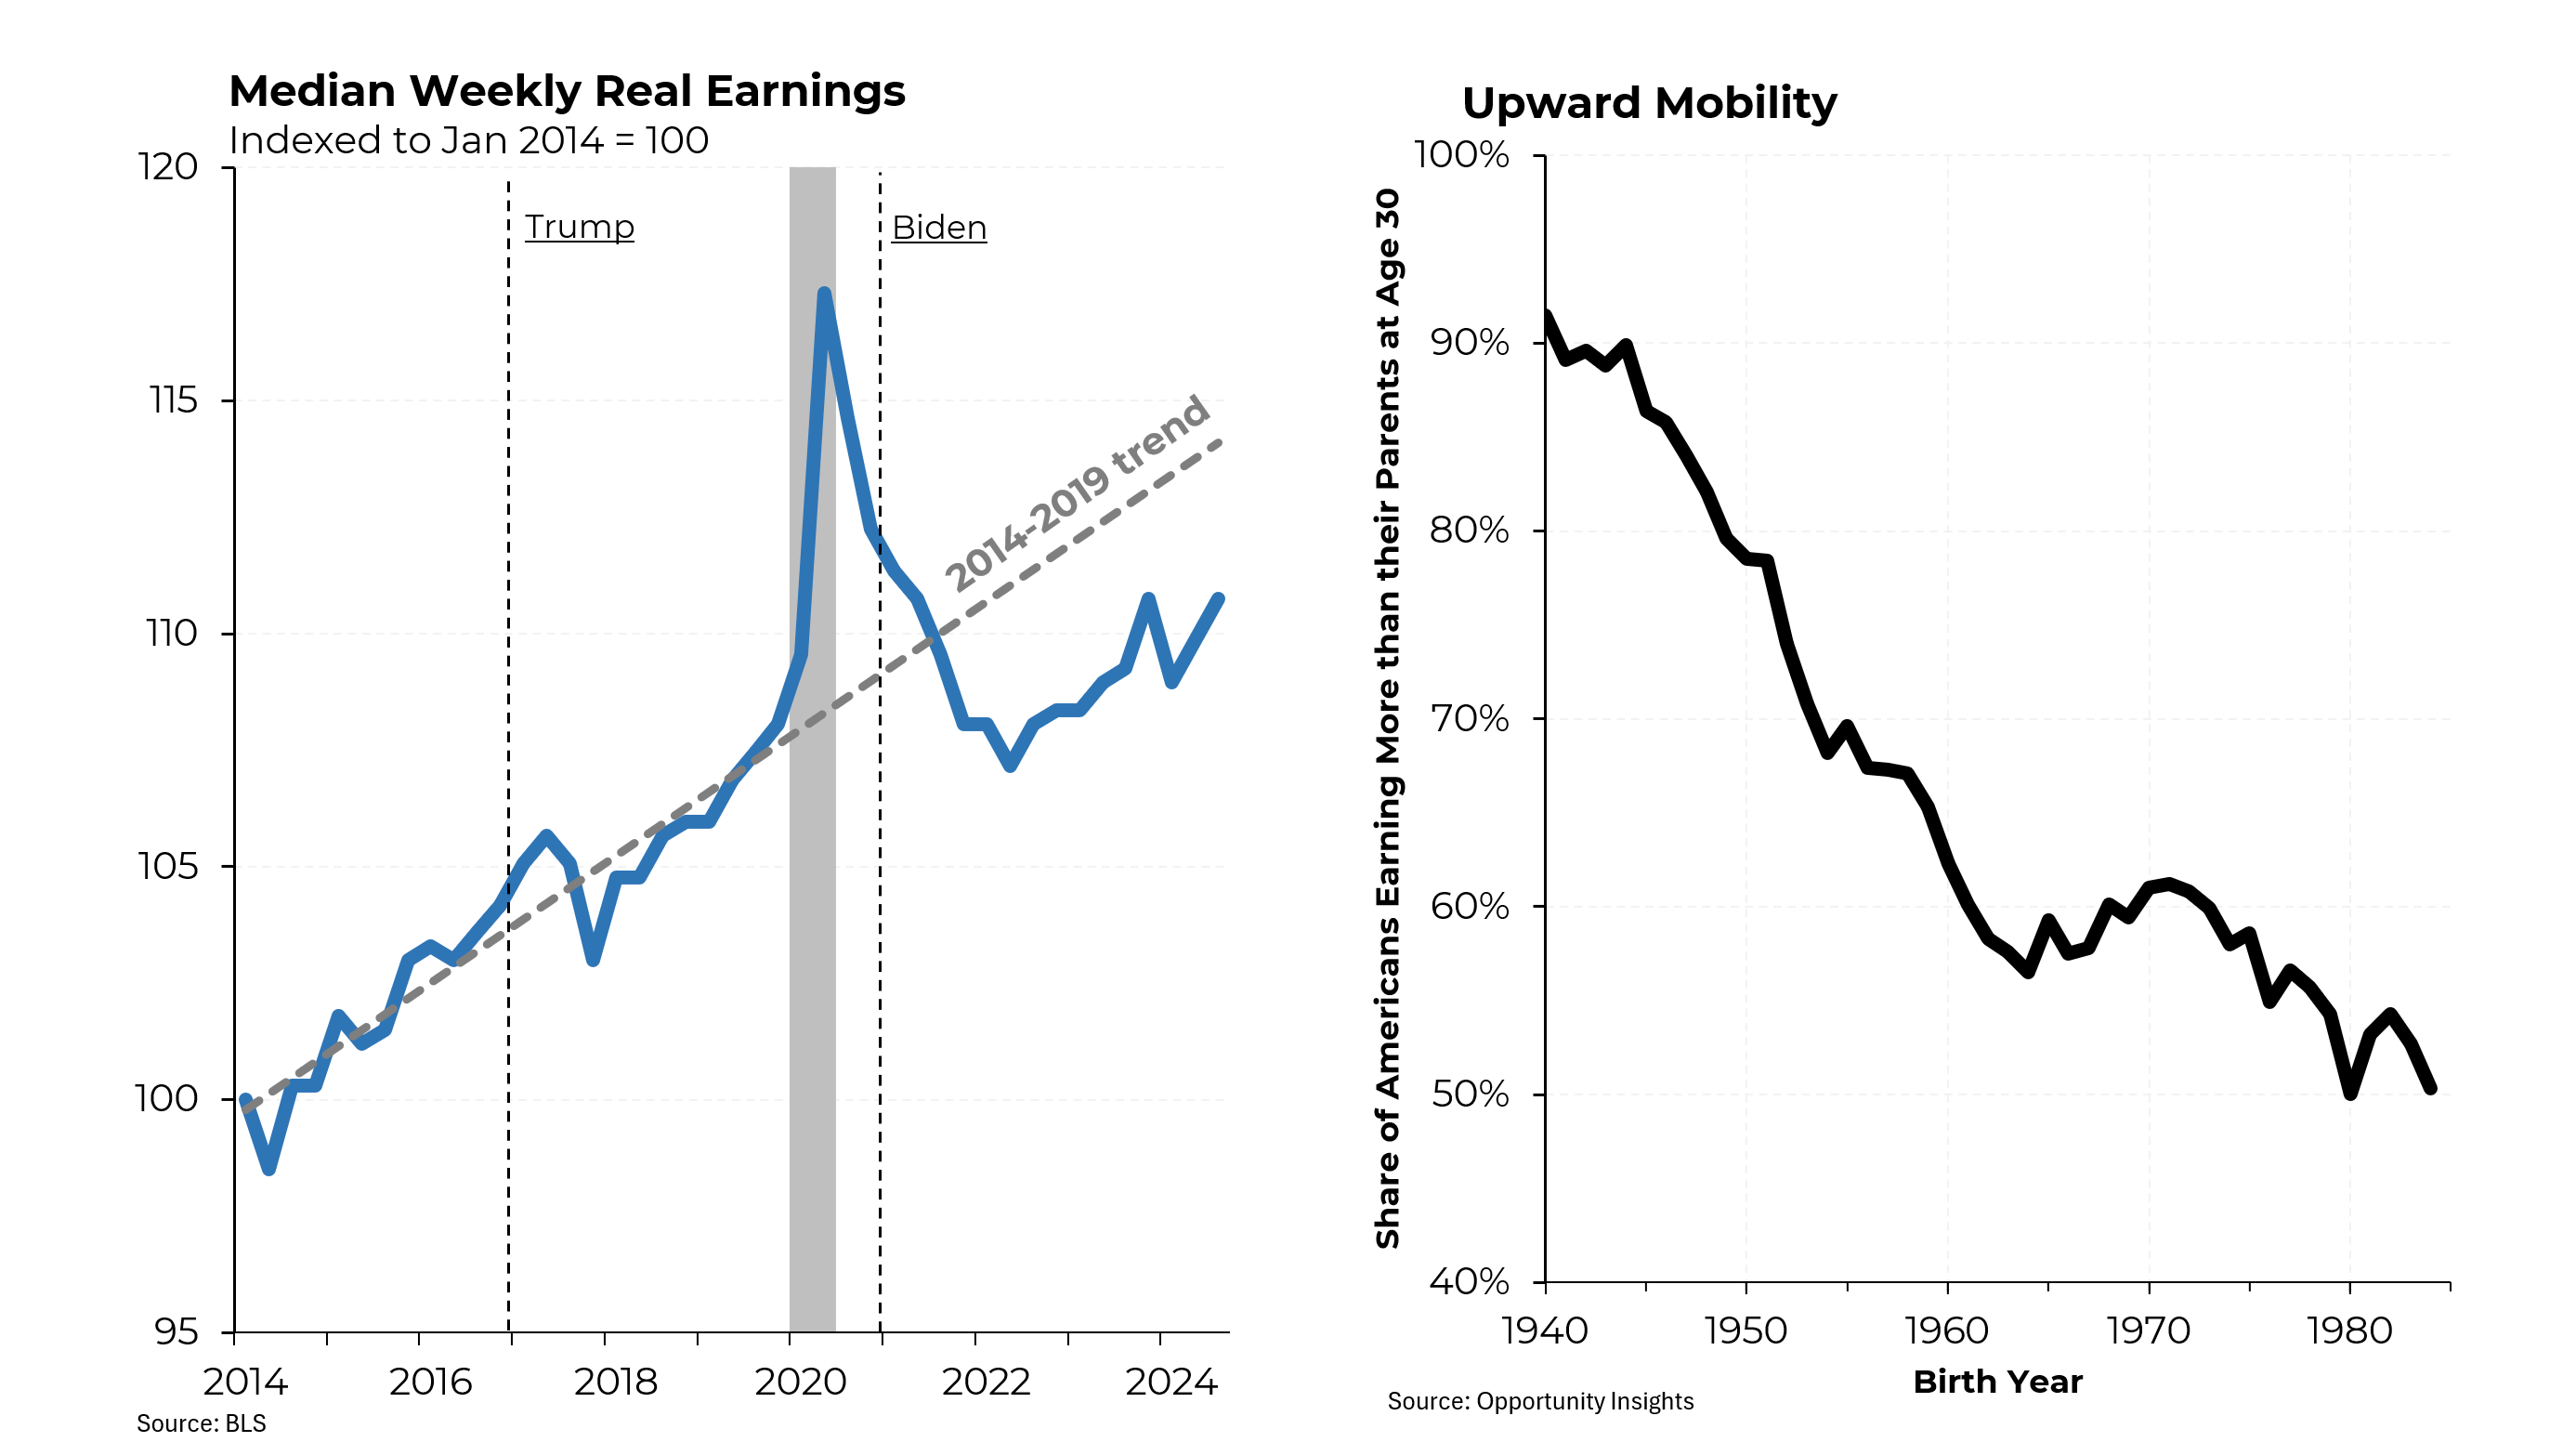
Voters were deeply troubled about inflation and its impact on their spending power. While the data indicates that “real incomes” did not go down, neither did they go up; adjust for the impact of Covid, they were probably roughly unchanged over the past four years. But that itself was a negative development; from 2014 through the end of 2019 (much of that period covering the first Trump administration), median wages grew by 8%. If they had continued to grow at that rate, they would be 3% higher now, instead of being roughly flat over that period.
Lurking behind concerns about stagnant purchasing power may be a deeper issue: a worry that the American Dream may no longer exist for too many younger citizens. It used to be that upwards of 90% of a rising generation earned more than the previous generation (as measured at age 30). That share dropped to 62% by 1990 for those born in 1960 and to 50% in 2010 for those born in 1980. Importantly, this decline hit the industrialized Midwest and the middle class the hardest. An April 2024 Pew poll found that 41% of Americans think the American Dream was once possible but no longer is, 53% think it is still possible and 6% thought it was never possible.

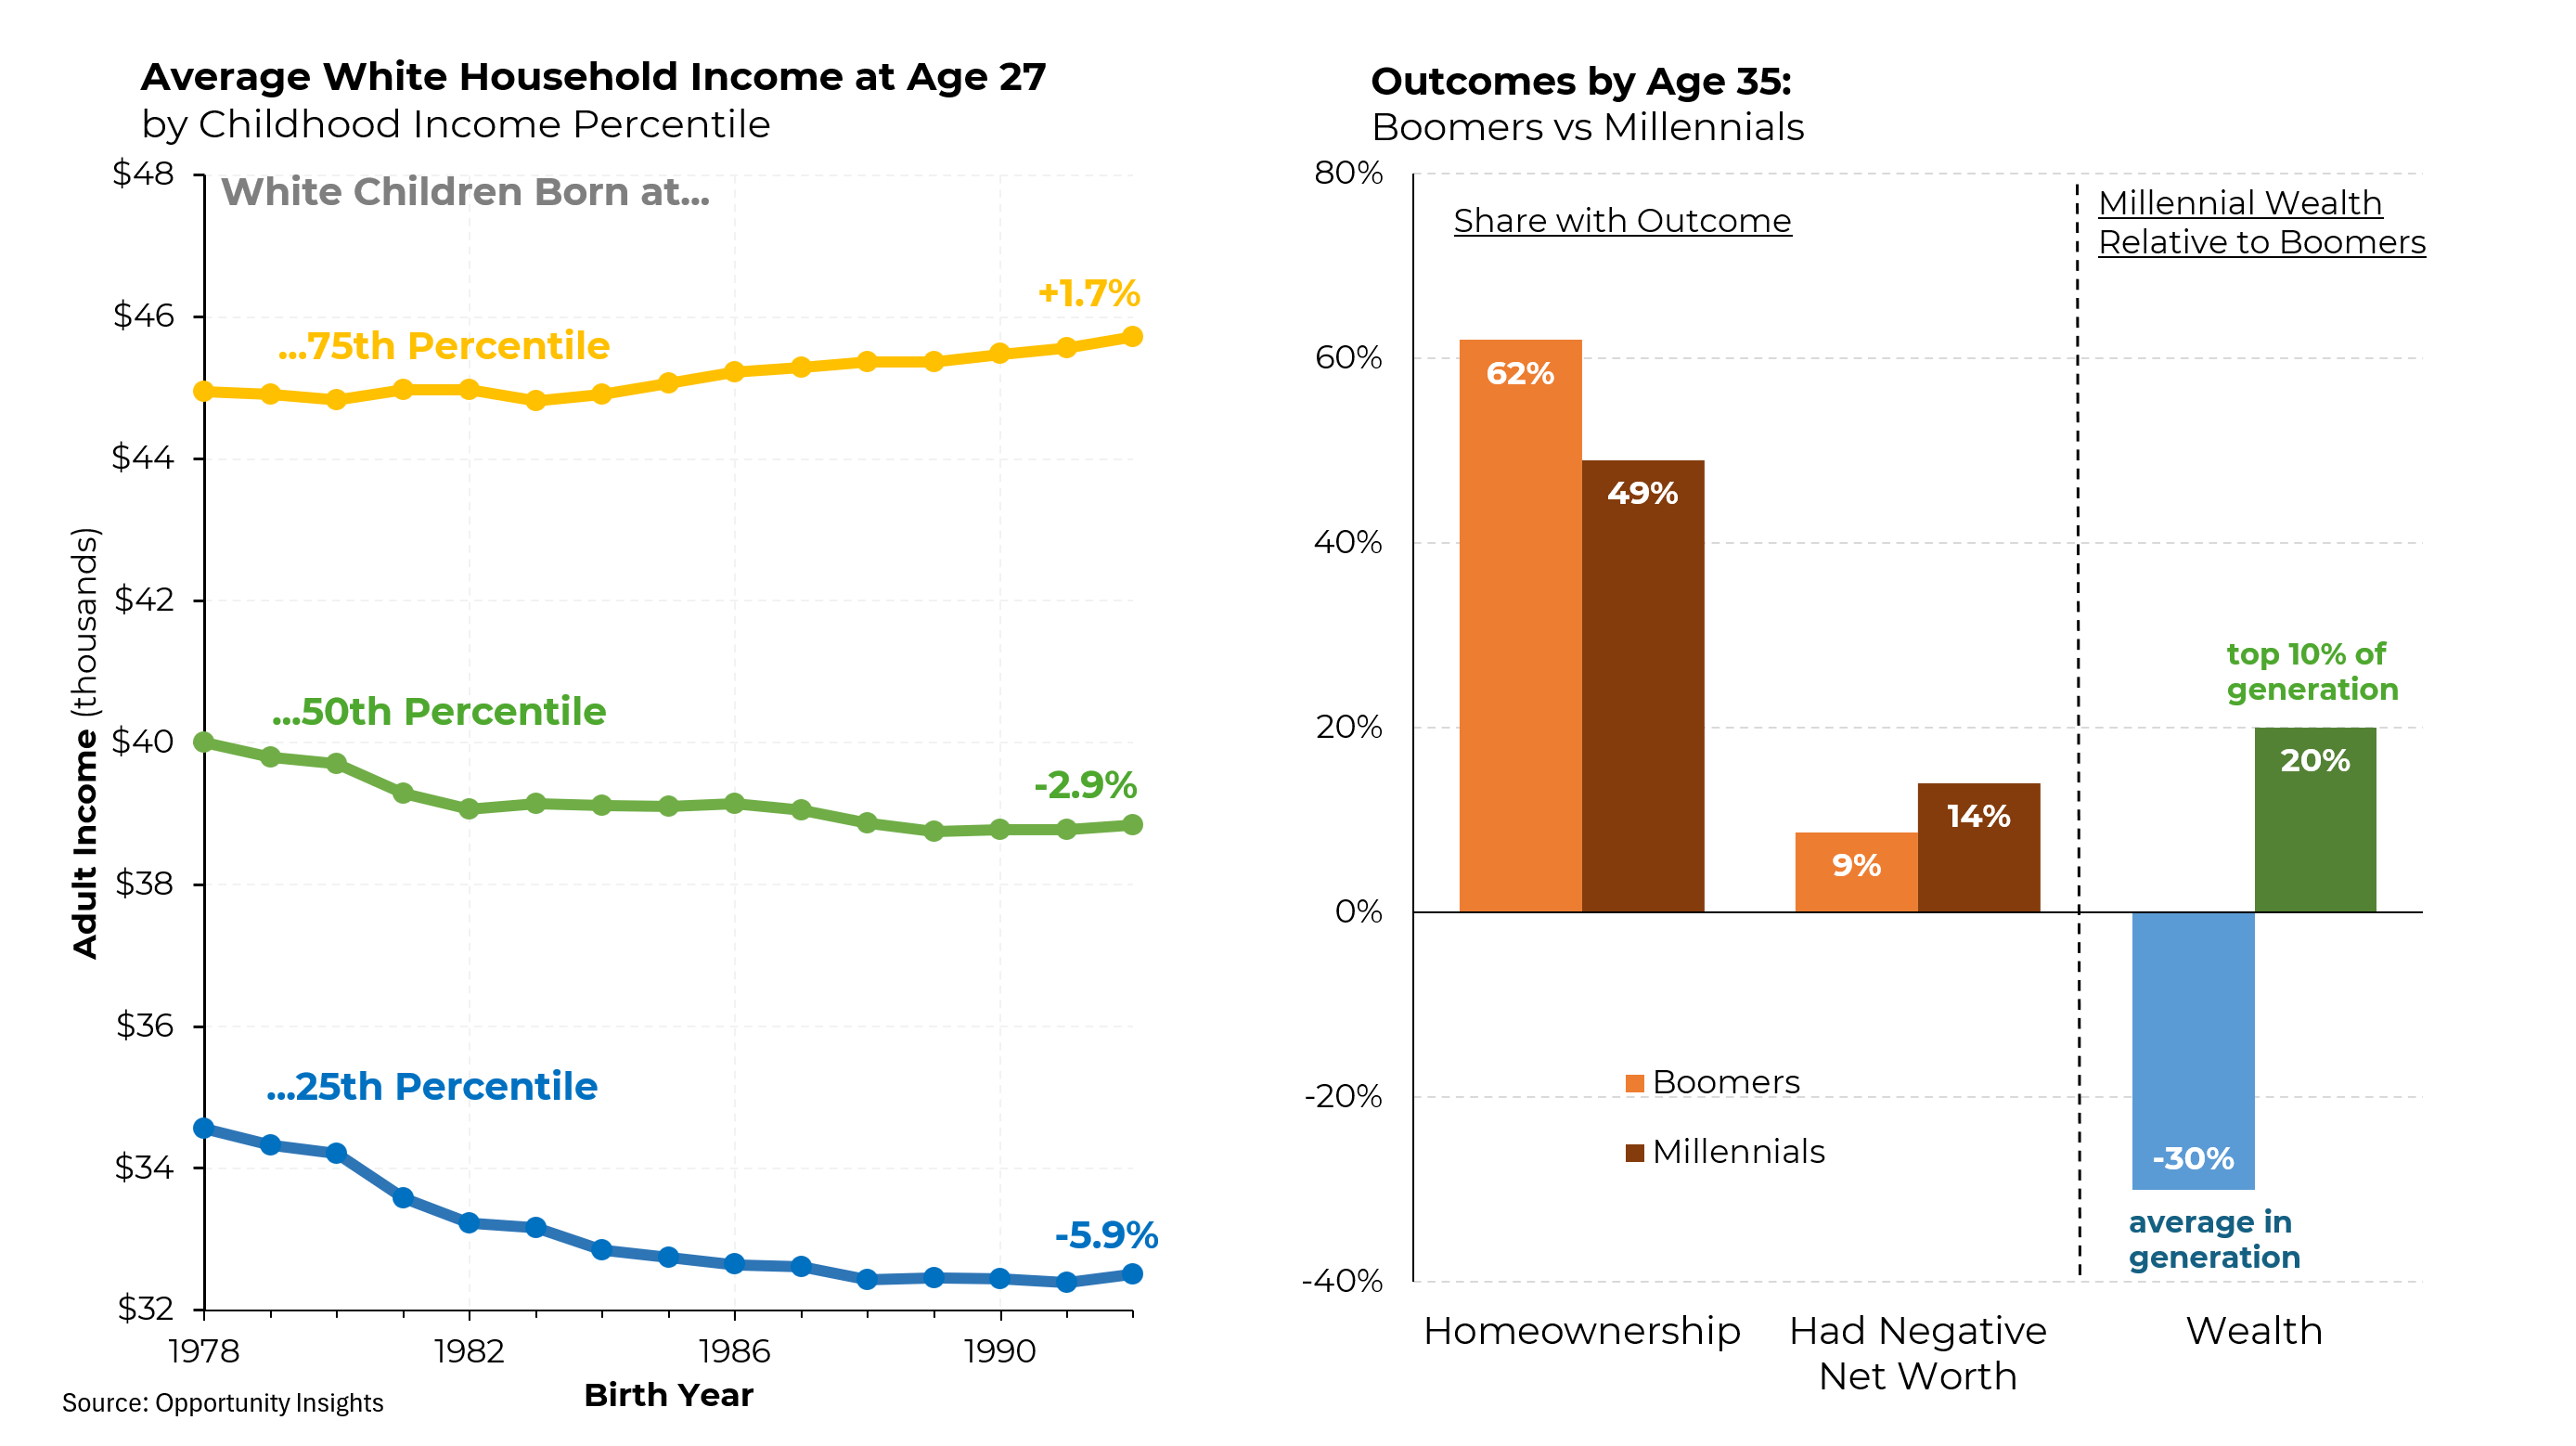
Another way to measure the drop in upward mobility is by income strata. White children born in 1992 to families in the 25th percentile of household income had 5.9% lower adult incomes (after adjusting for inflation) than children born in similar households in 1978. Those in the middle of the family income distribution had 2.9% lower incomes while those in the top quarter had 1.7% higher incomes. Importantly, these trends are particularly driven by white men.
Then there’s wealth. While 62% of baby boomers owned homes by age 35, only 49% of millennials did. Millennials were also more likely to have negative net worths. In terms of overall wealth, the average millennial had 30% less than their baby boomer counterparts, but the top 10% of millennials had 20% more — indicating far more wealth income inequality among millennials at age 35 than there had been among baby boomers at the same age.

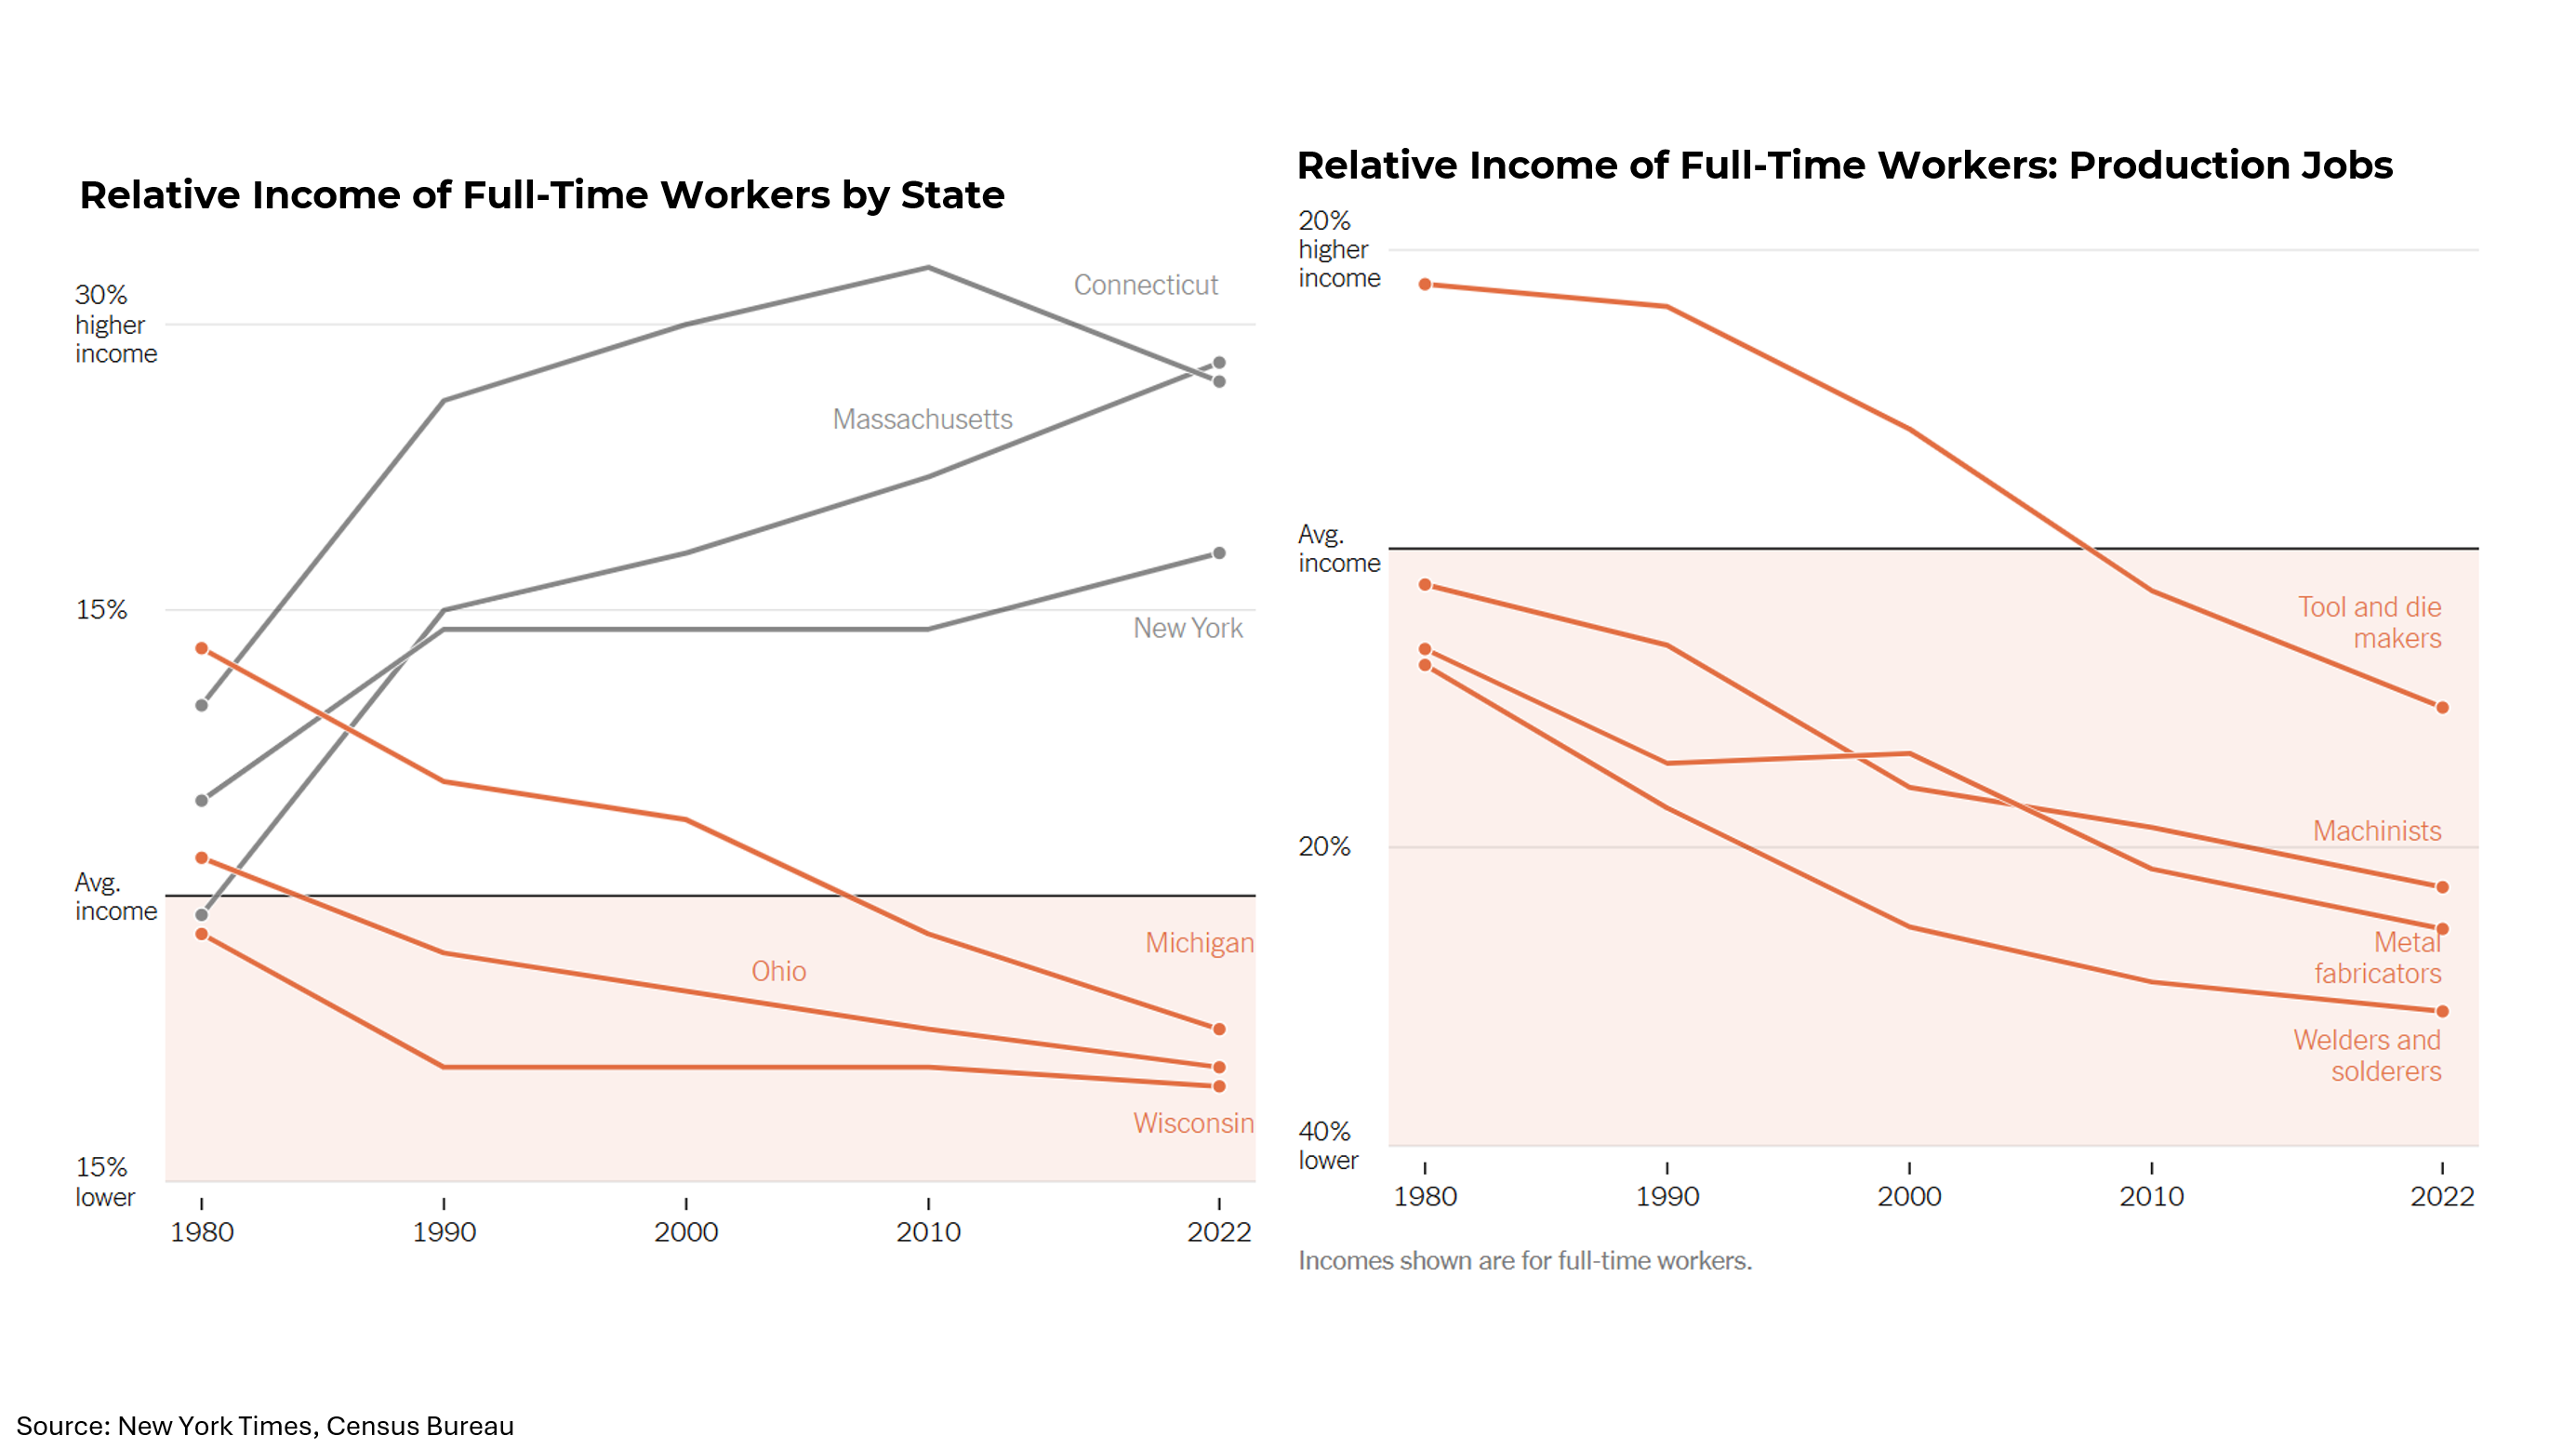
The aforementioned statistics are, of course, national averages. Regional differences also play a significant role in explaining Kamala Harris’s loss, particularly in the industrial Midwest. Over the past 42 years, relative income of workers in Michigan, Ohio and Wisconsin has fallen from mostly above the national average to significantly below it. Meanwhile, “blue states” like Connecticut, Massachusetts and New York have prospered.
Those regional changes were heavily driven by the relative decline in wages for manufacturing workers. Tool and die makers, for example, went from earning nearly 20% above the national average to earning 10% less than the average. Other job categories, like machinists, metal fabricators and welders, experienced similar declines.


