Many economists believe that the state of financial markets, the economy and other quantitative metrics can be used to successfully predict the outcome of presidential elections. Below are three charts laying out three different methodologies. For video clip, click here.
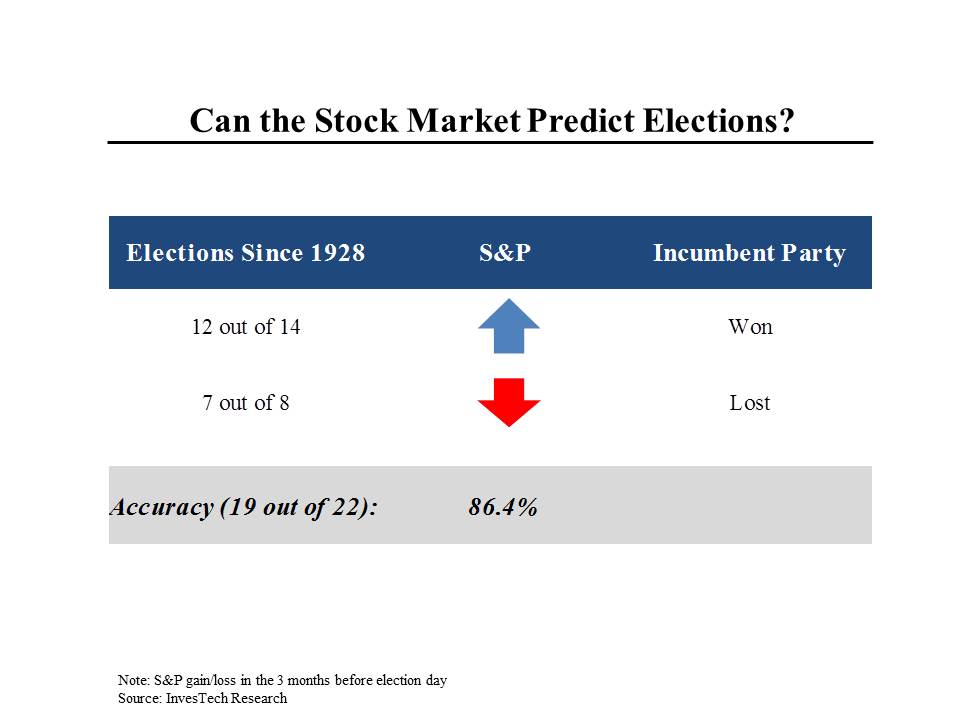
The stock market has an excellent record of picking presidents. Over the past 22 elections — going back to 1928 — the change in the stock market over the three months before election day has determined the outcome of the election 86% of the time. When the stock market is up over that period, the incumbent party stays in office. When the stock market goes down, the out of power party takes over. Since the stock market goes up more often than it goes down, that means that the incumbent party stays in power more often than it loses power (12 out of 22 times). The only three times that this approach has failed were 1956, 1968 and 1980. In both 1968 and 1980, the market was up substantially but the party in power (Democrats in both cases) still lost — perhaps because of other factors like Vietnam, inflation and the Iranian hostages.
Of course, we won’t know what this indicator will be predicting until shortly before Election Day.

It is easier to estimate the economic numbers than the stock market.
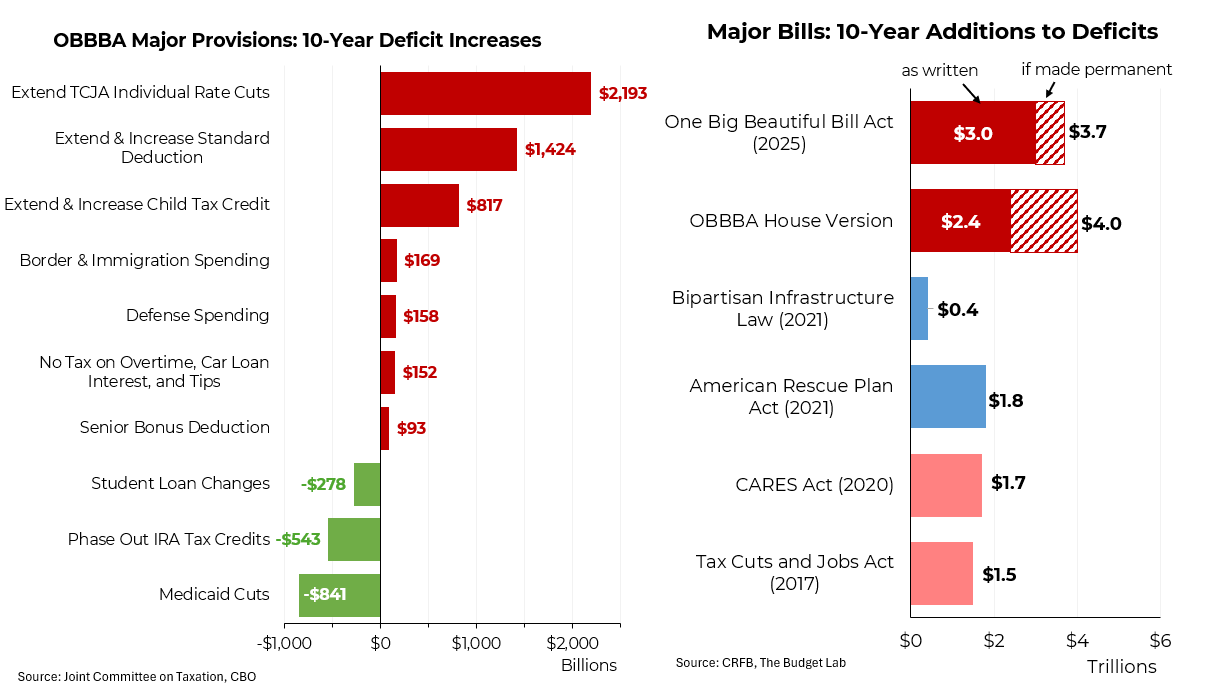
Perhaps the best known and most successful purely economic model was developed by Ray Fair, a professor at Yale. It looks at GDP growth per capita and inflation to arrive at a prediction for what share of the popular vote each party is likely to get. Because this recovery has been so sluggish, even though inflation has also been low, almost any realistic assumptions about how the economy might perform between now and election day leads to a Republican victory. In fact, using consensus estimates for how the economy will do this year, the model is predicting a Republican landslide — the Democratic candidate can expect to get only around 46% of the vote.
This model has been back tested to 1916 and has only been wrong 3 times. One of those, ironically, was in 2012, when the model predicted that President Obama would get 49% of the vote; he actually received 51.3%. Like more conventional polls, the model has a margin of error (2.5%) so its result was within the margin of error. (Note that even the margin of error may not be enough to save the Democratic candidate if the model works this time.)

A third approach was developed by Alan Abramowitz, a professor at Emory University in Atlanta. His approach mixes two political variables with one economic variable. First is the incumbent’s approach rating on election day, which is assumed to be 50%. Second is GDP growth in the second quarter of this year, which is assumed to be 2.4%. And third is how many terms the incumbent party has been in power, because it is very rare for a party in power for two terms to keep the White House. By this methodology, the Democratic candidate can expect to receive 48.7% of the vote. Prof. Abramowitz cautioned us that in his view, if Trump or Cruz is the nominee, President Obama’s approval rating could rise as voters start to make a comparative evaluation of the alternatives.