The Chinese stock market started the year in free fall, with one key index – the CSI 300 – dropping nearly 12% in just four days of trading. That contributed to a terrible start to the year for stock markets around the world: As of Thursday’s close, the S&P was down 4.9% so far in 2016, Europe was down 5.3% and Japan was down 6.6%. (For video clip, click here)
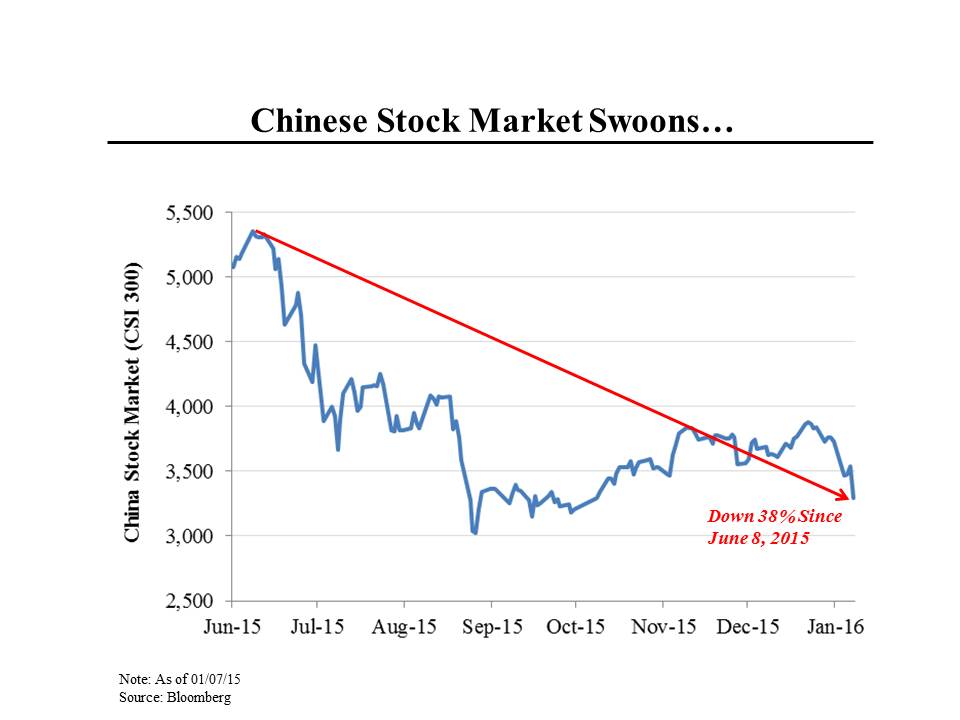
Judging by most the press commentary, the Chinese stock market — and derivatively, the whole country — would seem to be a basket case. The Shanghai market — the most important domestic exchange — is now about 38% below where it was in early June of last year. That’s a drop on the order of the size of the drop in the US during the financial crisis.
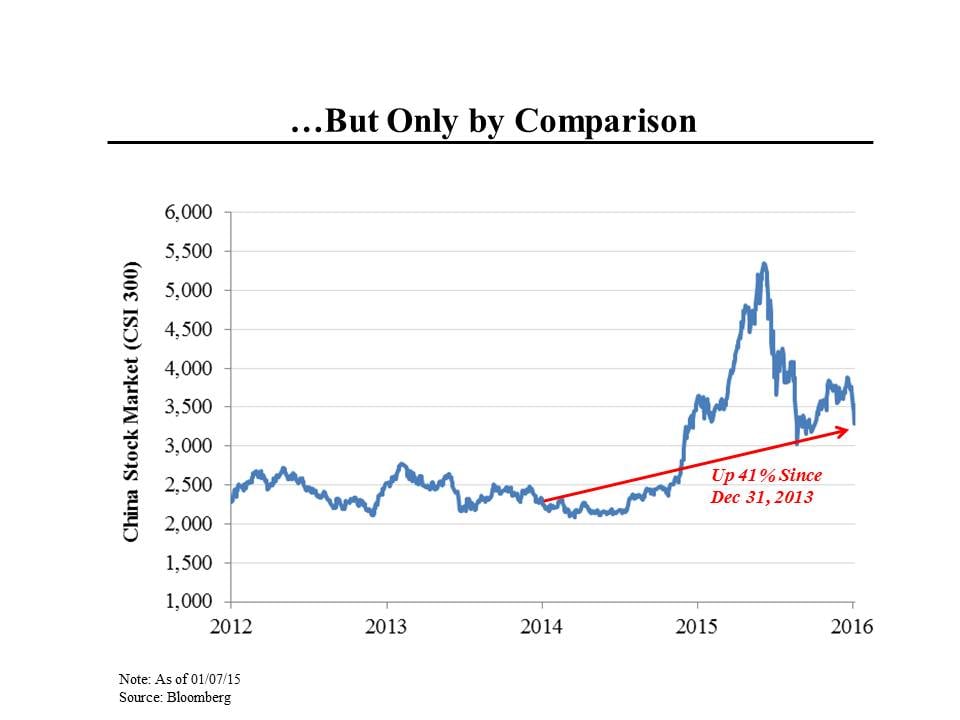
But that’s too narrow a picture. As this chart shows, the decline in the stock market since June doesn’t even reverse the run up in the stock market beginning in the summer of 2014. And before that, the Chinese market was more or less moribund for several years, even while the US market was going up sharply (32% in 2013 and 14% in 2014).
The real problem with the Chinese stock market is that the regulators don’t know how to manage free markets. They first encouraged people to buy stocks and then discouraged them. When the market began to decline last spring, the government bought stocks directly to try to shore up prices — always a losing game. This year, they have badly managed automatic “circuit breakers” that are designed to stop trading when markets get too volatile.
Similarly, the Chinese government has been trying to devalue its currency, the yuan, but again, has both managed the decline so ineptly and communicated so poorly to the market about what it was doing, that instead of adding stability, it has made matters worse.
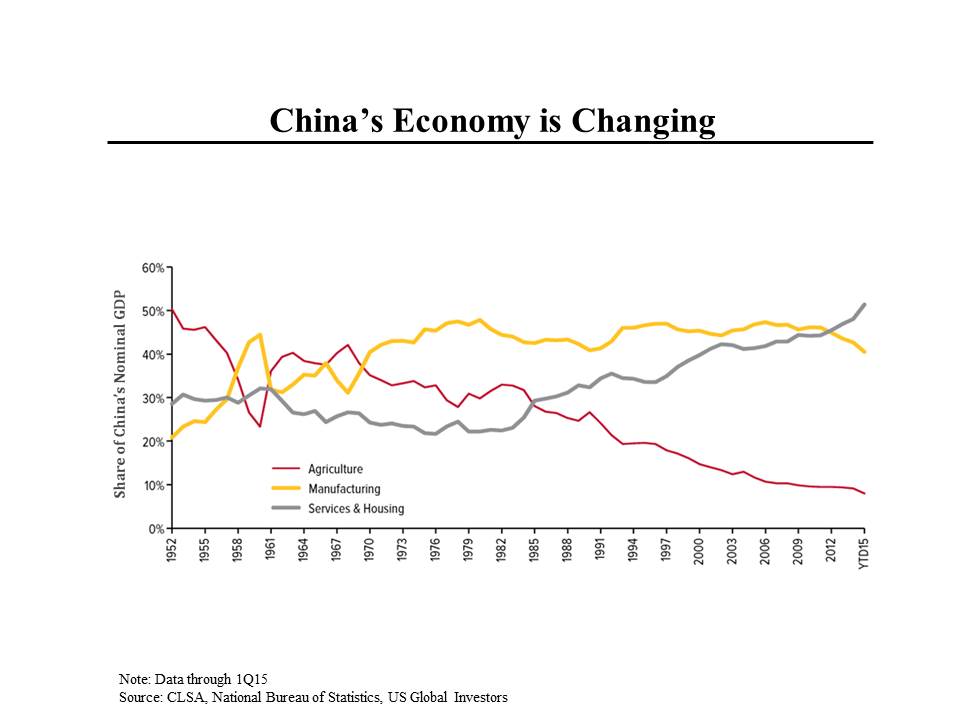
Both the Chinese and US markets have also been spooked by poor economic data out of China, particularly manufacturing numbers. As this chart shows, manufacturing, which has traditionally been the engine of China’s market, has begun to decline, both as a share of GDP and in absolute terms. But while manufacturing is declining, services have been rising, again both in absolute terms and as a share of GDP.
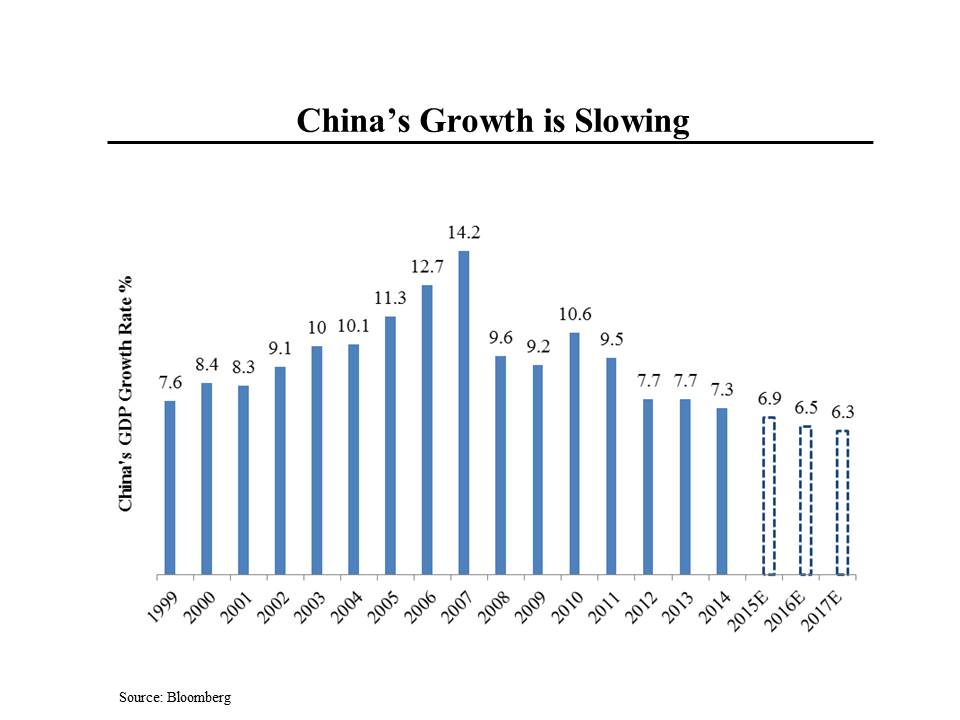
All told, according to consensus estimates, China’s economy grew just under 7% last year, a significant deceleration from past years but still way above the 2% or so that the US is growing. That said, most experts don’t believe the Chinese numbers and think the economy is growing more in the 3 to 4% range. But even that would be substantially faster than the US or Europe are growing.


